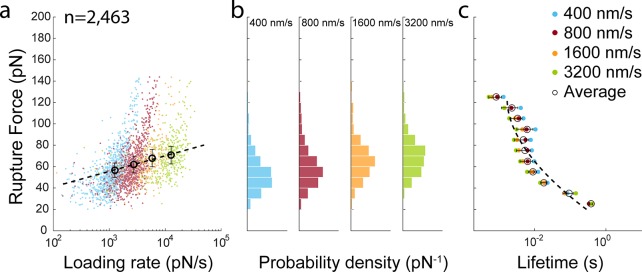
Figure 2.
Dynamic force spectroscopy on VHH(WT)/mCherry complexes. (a) VHH(WT)/mCherry complex rupture events detected at four pulling speeds from 400 to 3 200 nm/s. Colored points represent rupture events of individual molecular complexes. Open circle markers represent the most probable rupture force and average loading rate at each pulling speed. The dashed line represents the Bell-Evans fit to the open circle. (b) Rupture force histograms at each pulling speed. (c) Lifetime plot obtained using histogram transformation based on the DHS model with v = 0.5. The dashed line represents the fit to the DHS model.

