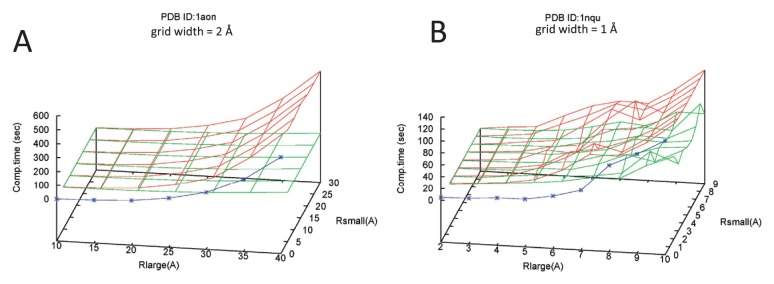
Figure 6.
Computation times for cavities, pockets, and cave pockets for the two macromolecular complexes. The blue, green, and red lines correspond to computation times for cavities, pockets, and cave pockets, respectively. The calculations were performed using the GHECOM program. The GHECOM program was run using the single core of a Linux machine with a Core i7-6930K CPU. (A) GroEL/ES (PDB ID: 1aon). Grid width is 2 Å. (B) lumazine synthase (PDB ID: 1nqu). Grid width is 1 Å.

