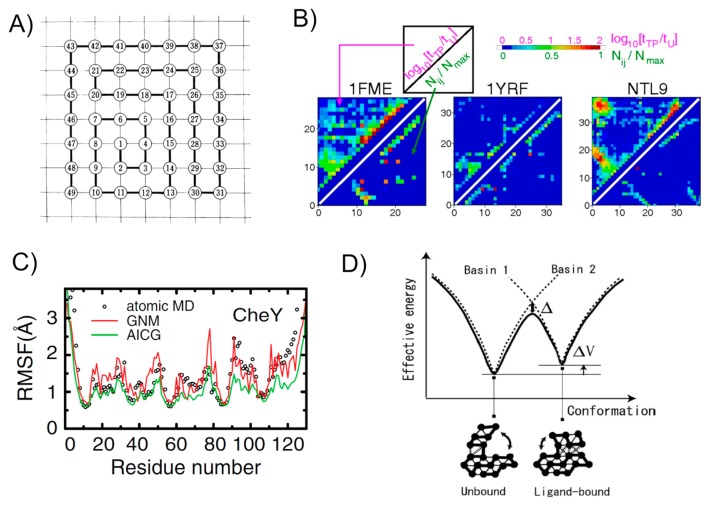
Figure 1.
Various studies with Gō models. A) One of the original two-dimensional lattice models used by Gō. The figure taken from [5]. B) A stringent test of the assumption in Gō models. For contact i and j, the log ratio of lifetime in the transition-path tTP to lifetime in the unfolded state tU is plotted by color in upper-left triangle, while the native contact map is depicted in the lower-right triangle. Results for three proteins are drawn here. The figure taken from [35]. C) Comparison of the root mean square fluctuation in the native basin for a test protein CheY. Results from all-atom MD (black circles), an elastic network model (GNM) (red curve), and a Gō model (green curve) are compared. The figure taken from [30]. D) A schematic plot for the multiple-basin Gō model that is based on two single Gō models. The picture taken from [41].

