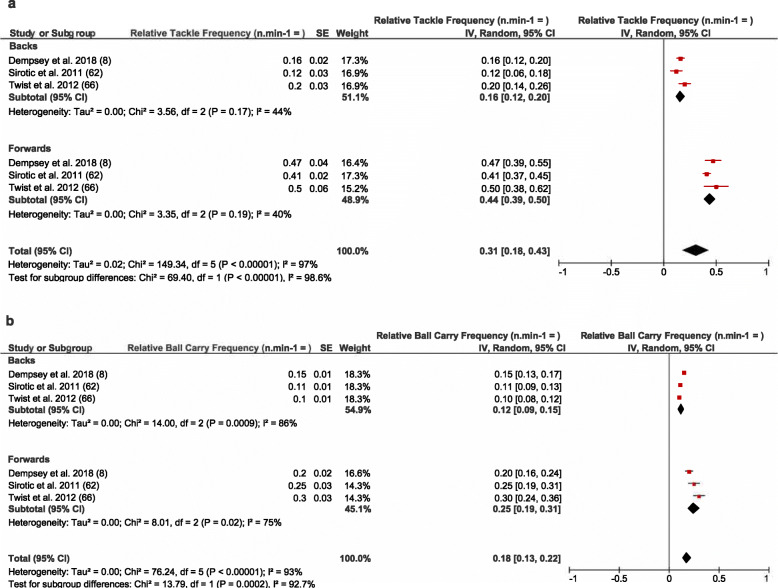
Fig. 4.
Meta-analysis of studies reporting relative (n min−1) tackle and ball carry frequency from video analysis. The forest plot (mean and 95% confidence interval [CI]) was used to present the results of the meta-analysis and combined pooled estimates for a relative tackle frequency for backs and forwards and b for relative ball carry frequency for backs and forwards. Within the plot, squares and horizontal lines represent individual study mean and 95% CI and diamonds represent pooled mean and 95% CI

