
Fig. 2. Comparison between dentine collagen carbon (δ13Cdcol) and nitrogen (δ15Ndcol) isotope profiles of M1s and M2s from caves (green) and monuments (blue).
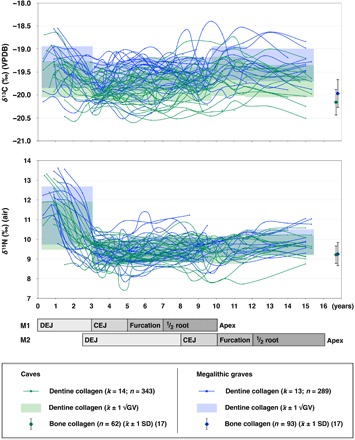
Shaded areas represent the mean values ±1 pooled SDs (√GV) at different age periods (0 to 2.9, 3 to 4.9, 5 to 6.9, 7 to 9.9, 10 to 11.9, and 12 to 16). Mean values obtained on the bone collagen (δ13Cbcol and δ15Nbcol) of cave and megalithic individuals at adulthood (18) are shown for reference. A schematic graph has been included to illustrate the correspondence between tooth developmental ages and anatomy (34) used to assign age to each dentine sample (where DEJ is dentine enamel junction, CEJ is cementum enamel junction, and VPDB is Vienna Pee Dee belemnite).