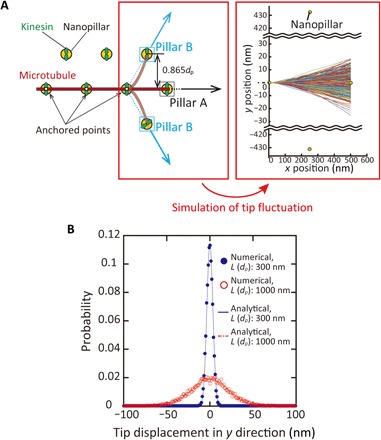
Fig. 3. Simulation of a fluctuating leading tip of microtubules.

(A) Schematic illustration of a fluctuating tip of the microtubule (left) and representative traces of the simulated shape of the tip (right). Traces were obtained by 500 runs of a simulation. (B) Probability density function of the displacement of the tip in y direction. L, the length of a free tip; dp, the spacing between pillars. n > 10,000.
