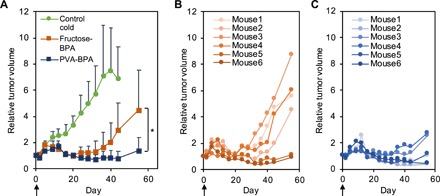
Fig. 4. Antitumor effect in a subcutaneous hypovascular BxPC-3 tumor model.

(A) Tumor growth curves. The indicated samples were intravenously injected, and the tumors were irradiated with epi-/thermal neutrons 3 hours after injection on day 0. The results are expressed as means ± SD (n = 8 for control; n = 6 for fructose-BPA and PVA-BPA). *P < 0.05 (one-way Student’s t test). (B and C) Individual tumor growth treated with (B) fructose-BPA and (C) PVA-BPA.
