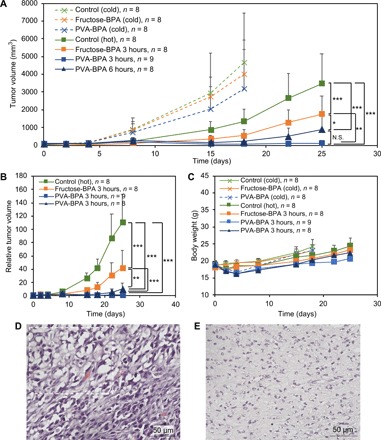
Fig. 5. Antitumor effect in a subcutaneous hypervascular CT26 tumor model.

(A and B) Tumor growth curves. The indicated samples were intravenously injected, and the tumors were irradiated with epi-/thermal neutrons 3 or 6 hours after injection on day 1. The results are expressed as means ± SD. *P < 0.05, **P < 0.00001, and ***P < 0.00000001 (Bonferroni method) in (A). N.S., not significant. **P < 0.0001 and ***P < 0.000001 (Bonferroni method) in (B). (C) Body weight. The results are expressed as means ± SD. (D and E) Histology (hematoxylin and eosin) of tumors treated by BNCT with (D) fructose-BPA and (E) PVA-BPA (3-hour interval). The tumors were collected 25 days after the treatment. The dashed rectangle in (D) indicates a representative damaged region characterized by shrinkage of nuclei.
