
Fig. 1.
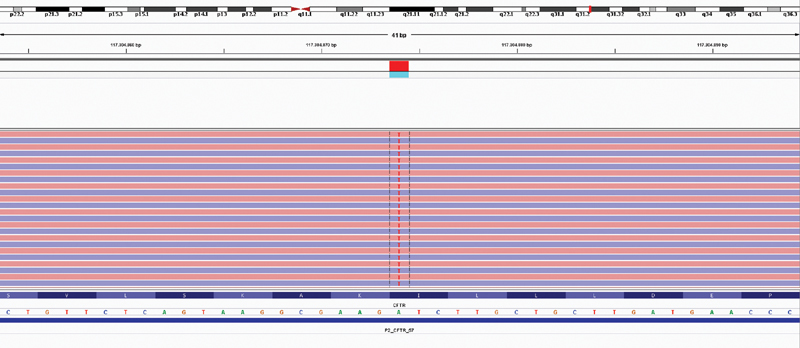
Results of CFTR sequence analysis (Illumina MiniSeq, NextFlex Cystic Fibrosis Amplicon Panel) of the patient. The A > T change present in the patient (red “T” at every line corresponds to one strand each, meaning this change is present in every strand read by the platform) is shown.