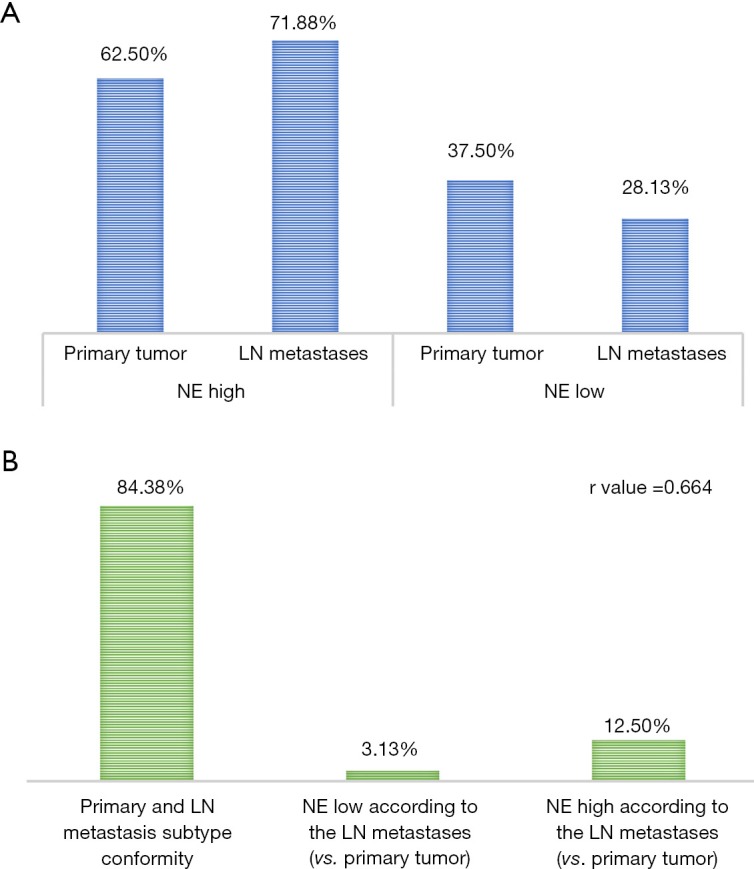
Figure 4.

Differences in patients tumor neuroendocrine (NE) subtype classification according to primary tumor or lymph node (LN) metastasis. (A) Percentage of patients in NE high vs NE low subgroup according to tissue origin (primary tumor, 62.50% vs. 37.50%; LN metastasis, 71.88% vs. 28.13%, respectively). (B) Conformity of NE pattern in LN metastatic samples and the primary tumor (r value: 0.664; 84.38% conformity; 12.50% NE high subtype and 3.13% NE low subtype according to LN metastases vs. primary tumors).
