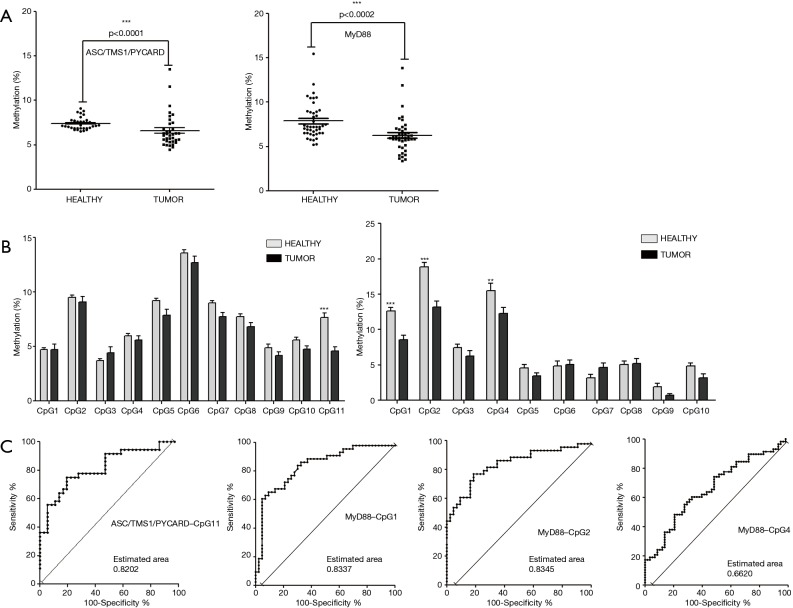
Figure 2.
Methylation status of the ASC/TMS1/PYCARD and MyD88 in the tumor and adjacent non-malignant tissues. (A) Correlation analysis of overall promoter methylation in non-tumor vs. tumor tissue from NSCLC patients. Each data point represents the mean percentage methylation (%) across the tested region of 11 tested CpG sites in the ASC/TMS1/PYCARD gene promotor (left panel) and 10 CpG sites in the MyD88 promoter (right panel). (B) Methylation status of individual CpG sites in the ASC/TMS1/PYCARD and MyD88 gene promoters. Each bar represents mean percentage methylation (%) of individual CpG sites. A grey bar represents healthy tissues and dark bars tumor tissues. The left panel corresponds to ASC/TMS1/PYCARD and right panel to MyD88. For (A) and (B) data were analysed using the paired t-test; P≤0.05 is considered significant. Data are presented as mean ± SEM. **, P≤0.01; ***, P≤0.001. (C) ROC analysis. The panels show the ROC analysis for ASC/TMS1/PYCARD CpG11 (panel 1) and MyD88 CpG1, 2 and 4 (panels 2, 3 and 4) to differentiate tumor from non-tumor tissue.

