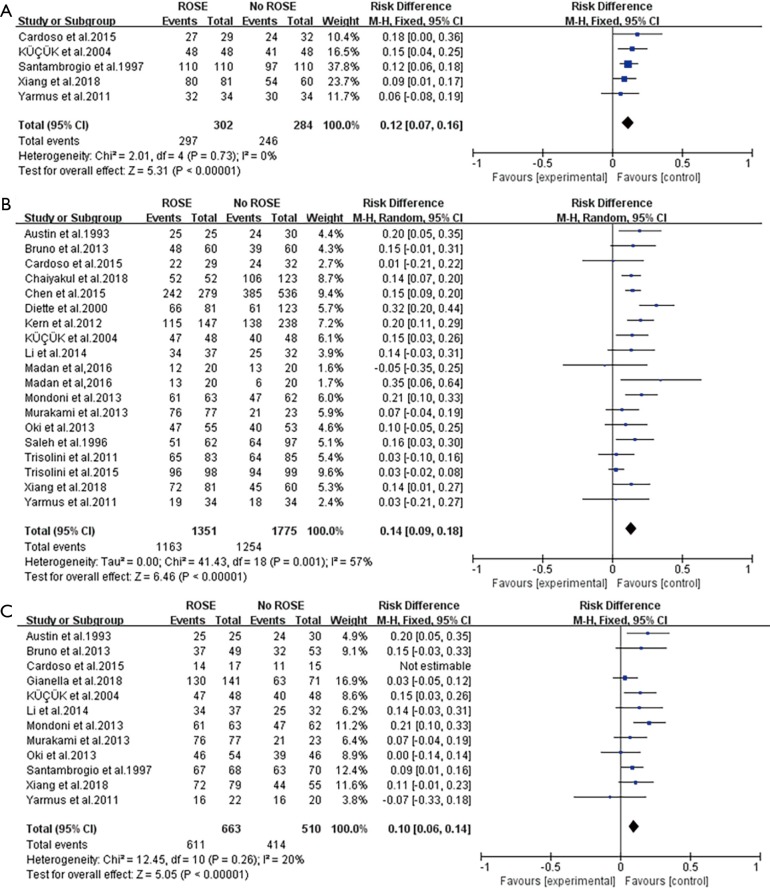
Figure 2.
Forest plots of primary endpoints. (A) Forest plot of the RD comparing the adequate rate of ROSE or without ROSE in the included studies; (B) forest plot of the RD comparing the diagnostic yield of ROSE or without ROSE in the included studies; (C) forest plot of the RD comparing the sensitivity in diagnosing malignancy of ROSE or without ROSE in the included studies. RD, risk difference; ROSE, rapid on-site evaluation.

