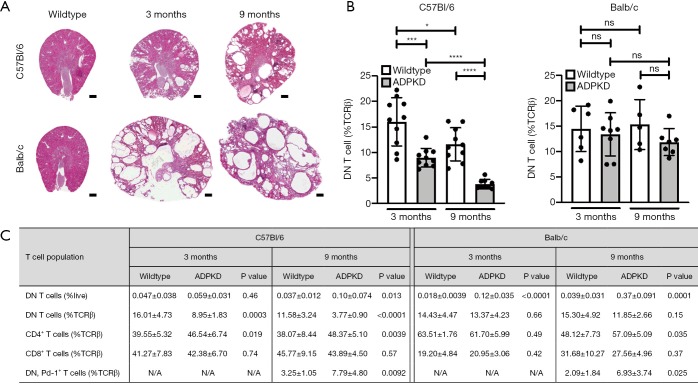
Figure 1.
Renal DN T cell frequency decreases with age and ADPKD severity in the C57Bl/6 background. (A) H&E stained renal cross sections of wildtype and ADPKD mice. In the orthologous ADPKD model, Pkd1R3277C/R3277C (17,18), polycystic kidney disease severity increases with age and overall disease severity is more pronounced in the Balb/c versus C57Bl/6 strain; (B) renal frequency of DN T cells as percent of all renal αβ T cells. DN T cells were gated using CD45+, TCRβ+, MHC II−, CD4−, CD8−. Note, this gating strategy does not differentiate between “true” DN T cells and NKT cells. In the C57Bl/6 strain, renal DN T cell frequency (%TCRβ) is significantly lower in ADPKD mice compared to wildtype mice and decreases significantly with age in both wildtype and diseased animals. In Balb/c mice, renal DN T cell frequencies remain steady independent of disease state or age; (C) tabular summary of renal T cell distribution. Globally, renal DN T cell numbers significantly increase with ADPKD severity in both strains (%live), which correlates to an overall increase in all renal T cell subpopulations as published previously (17). Renal DN T cells expressing Pd-1 are rare using our mouse perfusion and kidney digestion protocol as published previously (17), but this rare population is nonetheless significantly elevated in ADPKD mice compared to control. Scale bar 500 µm, statistics are expressed as mean ± SD, Statistical comparisons were made using unpaired t-test with Welch correction, *, P<0.05; **, P<0.01; ***, P<0.001; ****, P<0.0001. DN, double negative; ADPKD, autosomal dominant polycystic kidney disease.

