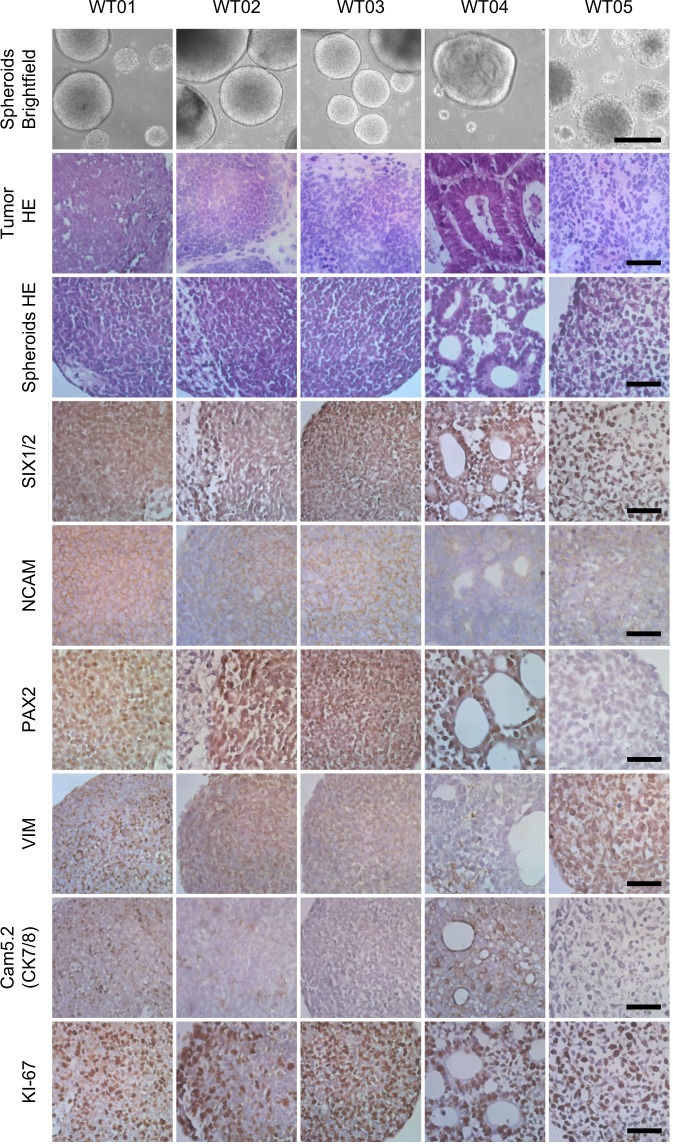
Fig. 1.
Histology of WT spheroids and corresponding tumor material. Representative spheroids are depicted by low power micrographs (brightfield, row 1). H&E staining showed similar histology of tumor material and corresponding spheroids (rows 2 and 3). IHC for renal progenitor/blastemal markers (SIX1/2, NCAM, and PAX2), the mesenchymal marker vimentin (VIM), the epithelial marker cytokeratin 7/8 (Cam5.2, CK7/8), and the proliferation marker Ki-67 was done on FFPE sections of spheroids. Scale bar: bright field 250 µm, H&E and IHC 25 µm

