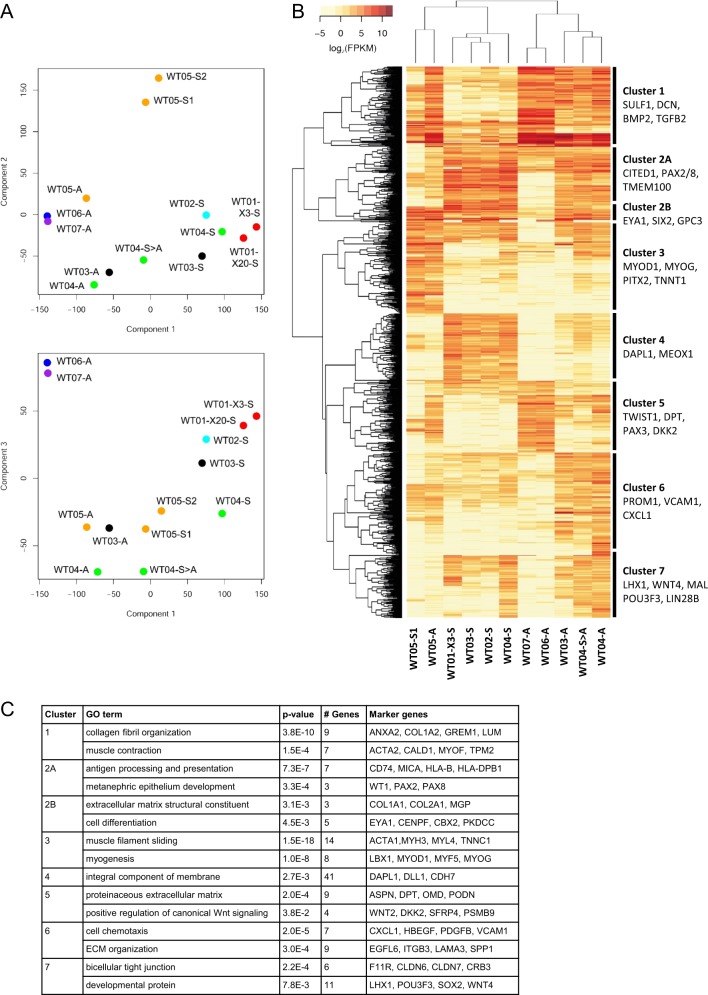
Fig. 2.
RNA expression profiling of WT cell cultures. Spheroid cultures (-S) with blastemal (WT01, WT02, and WT03), epithelial (WT04) and stromal (WT05) histology were analyzed by RNAseq together with primary adherent (-A), and spheroid derived adherent (-S>A) cells. To assess the impact of long-term in vivo cultivation WT01-X20-S (from the 20th xenograft passage) was included in addition to WT01-X3-S (from 3rd xenograft passage). Spheroid culture WT05-S2 (grown for 21 months) was included to study long-term in vitro changes. WT06-A and WT07-A are mesenchymal/stromal adherent cultures established with a slightly different protocol (lacking Y-27632) [18]. a Components PC1 (contribution 38.2%), PC2 (22.55%), and PC3 (11.37%) were used for principle component analysis of RNA expression. b Unsupervised clustering of 1000 most differentially expressed genes with fpkm ≥ 5 (table S2). c GO-term enrichment analysis of genes defining clusters 1−7

