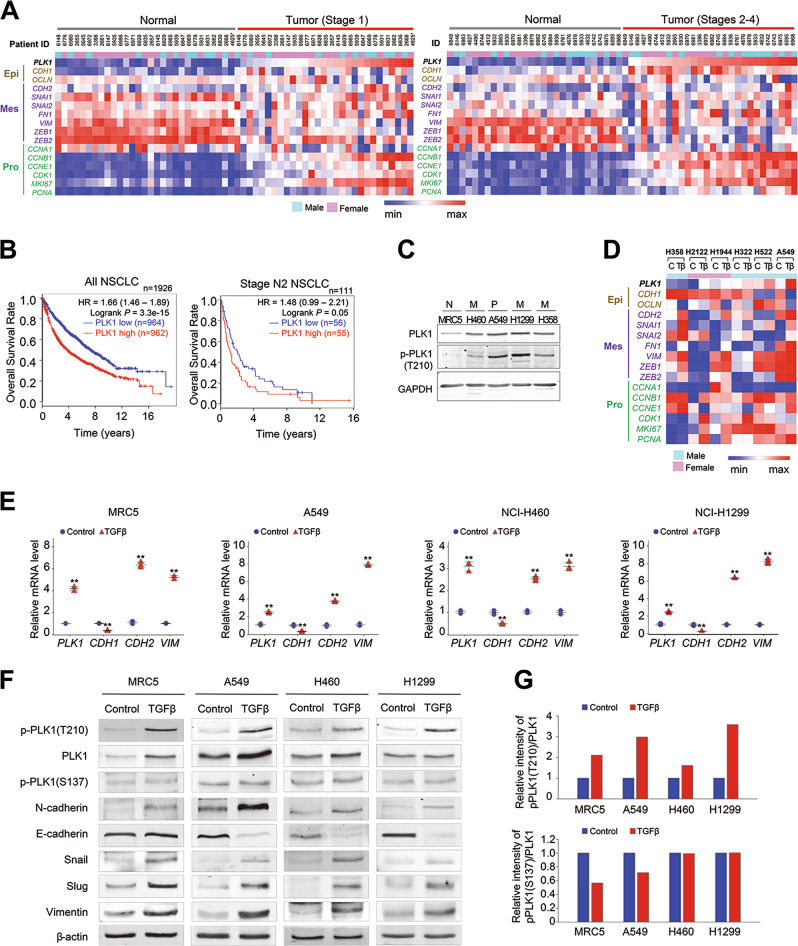
Fig. 1.
T210 of PLK1 is highly phosphorylated, but S137 is not in TGF-β-induced epithelial mesenchymal transition (EMT). a Heat maps were generated from TCGA lung adenocarcinoma patients’ dataset. Heat map showed the expression profile of genes, including PLK1, epithelial markers (Epi), mesenchymal markers (Mes), and proliferation markers (Pro) in paired normal and tumor tissues with stage 1 (right) or stages 2–4 (left). *4625 has missense mutation (S335C). b Cumulative overall survival of all NSCLC patients (left) and TMN stage N2 patients (right) according to PLK1 expression. Kaplan–Meier plot of overall survival rates for NSCLC patients was generated by splitting patients by their PLK1 expression levels (defined using median values), and the data were analyzed based on the log-rank test (left, n = 1926, HR = 1.66, log rank p = 3.3e-15; right, n = 111, HR = 1.48, log rank p = 0.05). c Expression and phosphorylation of PLK1 was measured using PLK1 and p-PLK1 (T210) antibodies in normal MRC5 lung cells, primary NSCLC A549, and metastatic NSCLC NCI-H460, NCI-H1299, and NCI-H358 cells. d A heat map analysis was performed for PLK1, epithelial marker CDH1 or OCLN, and several mesenchymal markers, including CDH2, using a published transcriptome of TGF-β-treated NSCLC (GSE 114761). e–g MRC5, A549, NCI-H460, and NCI-H1299 cells were treated with 2.5 ng/ml of TGF-β for 48 h. e qRT-PCR was performed for PLK1, CDH1, CDH2, and VIM expression using TGF-β-treated MRC5, A549, NCI-H460, and NCI-H1299 cells. *p < 0.05; **p < 0.01; ***p < 0.001. (n = 3). Data presented as mean ± SD. f Immunoblot analyses were performed for PLK1, p-T210-PLK1, p-S137-PLK1, N-cadherin, E-cadherin, vimentin, snail, slug, and β-actin using specific antibodies with lysates from MRC5, A549, NCI-H460, and NCI-H1299 cells treated with TGF-β. g The band intensity values of p-T210-PLK1, p-S137-PLK1, and PLK1 were quantified using LI-COR Odyssey software (Li-COR Biosciences). The band intensity values of p-T210-PLK1 and p-S137-PLK1 were normalized to those of PLK1 and plotted

