Fig. 2.
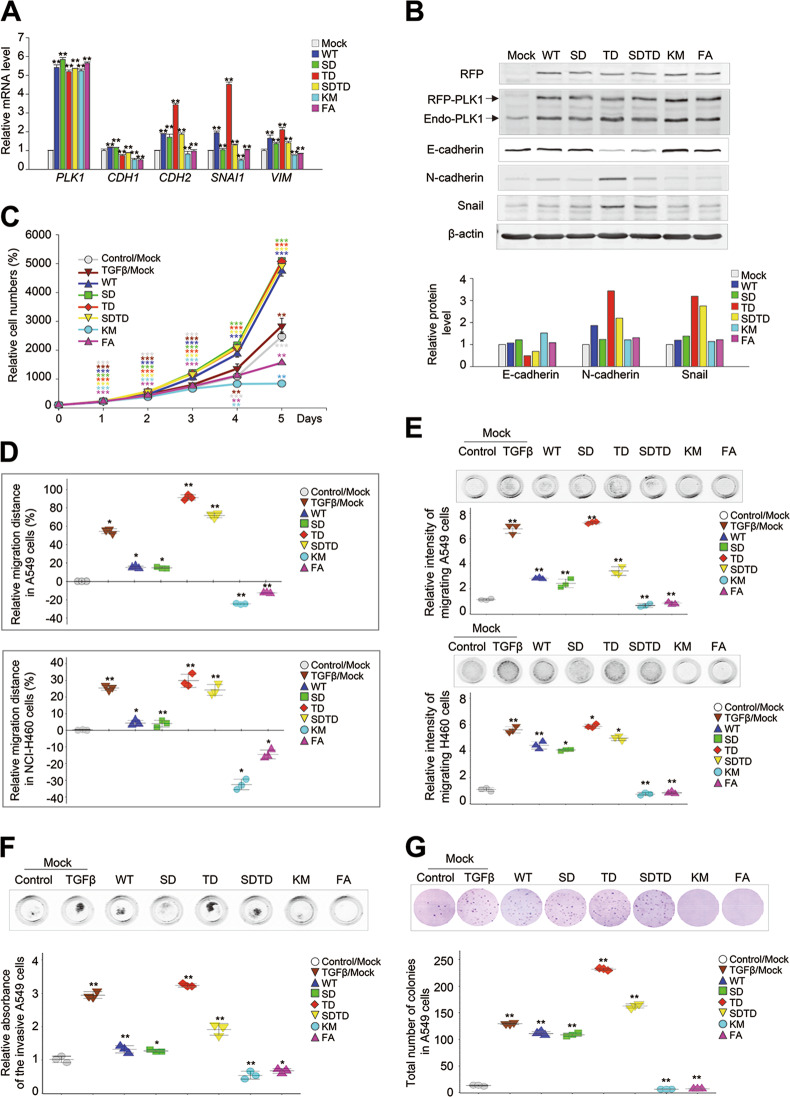
Expression of a catalytically active p-T210-PLK1 mutant induces tumorigenic and metastatic properties, including migration and invasiveness. Enhanced RFP (eRFP)-tagged wild-type (WT) PLK1 and S137D (SD), T210D (TD), S137D/T210D (SDTD), K82M (KM), and W414F/V415A (FA) mutants were expressed in NSCLC A549 and NCI-H460 cells. a A549 cells were selected with puromycin for 2 days and treated with doxycycline for 48 h. qRT-PCR was performed for PLK1, CDH1, CDH2, VIM, and SNAI1 in A549 cells expressing various versions of PLK1. *p < 0.05; **p < 0.01; ***p < 0.001. (n = 3). Data presented as mean ± SD. b Immunoblot analyses were performed using anti-RFP, anti-PLK1, anti-E-cadherin, anti-N-cadherin, anti-snail, and anti-β-actin (upper panel). The band intensity values were quantified using LI-COR Odyssey software (Li-COR Biosciences), normalized, and plotted (lower panel). (n = 3). c Cell proliferation assay was performed. (n = 3). d A549 (upper panel) and NCI-H460 (lower panel) cells expressing various versions of PLK1 were subjected to a wound-healing assay, as shown in Supplementary Fig. S2. TGF-β was used as a positive control. The scratch recovery efficiency after 72 h was analyzed using NIS-Elements Imaging software (Nikon, Japan), and the relative migration distance compared with the control was plotted. *p < 0.05; **p < 0.01; ***p < 0.001. (n = 3). Data presented as mean ± SD. e A549 (upper panel) and NCI-H460 (lower panel) cells expressing various versions of PLK1 were subjected to a transwell migration assay. Three days after seeding, the cells on the bottom layer surface were stained with 0.05% crystal violet dye, and the intensity values were measured using an Odyssey infrared imaging system (LI-COR Biosciences) and plotted. *p < 0.05; **p < 0.01; ***p < 0.001. (n = 3). Data presented as mean ± SD. f A549 cells expressing various versions of PLK1 were subjected to an invasion assay. Seven days after seeding, the cells that had been invaded on the bottom layer surface were stained with 0.05% crystal violet dye, and the relative absorbance was plotted. (n = 3) Data presented as mean ± SD. g A colony formation assay was performed with A549 cells expressing various versions of PLK1, as described in the Materials and Methods. After 4 weeks, the colonies formed in agar were counted after 0.05% crystal violet staining. *p < 0.05; **p < 0.01; ***p < 0.001. (n = 3). Data presented as mean ± SD

