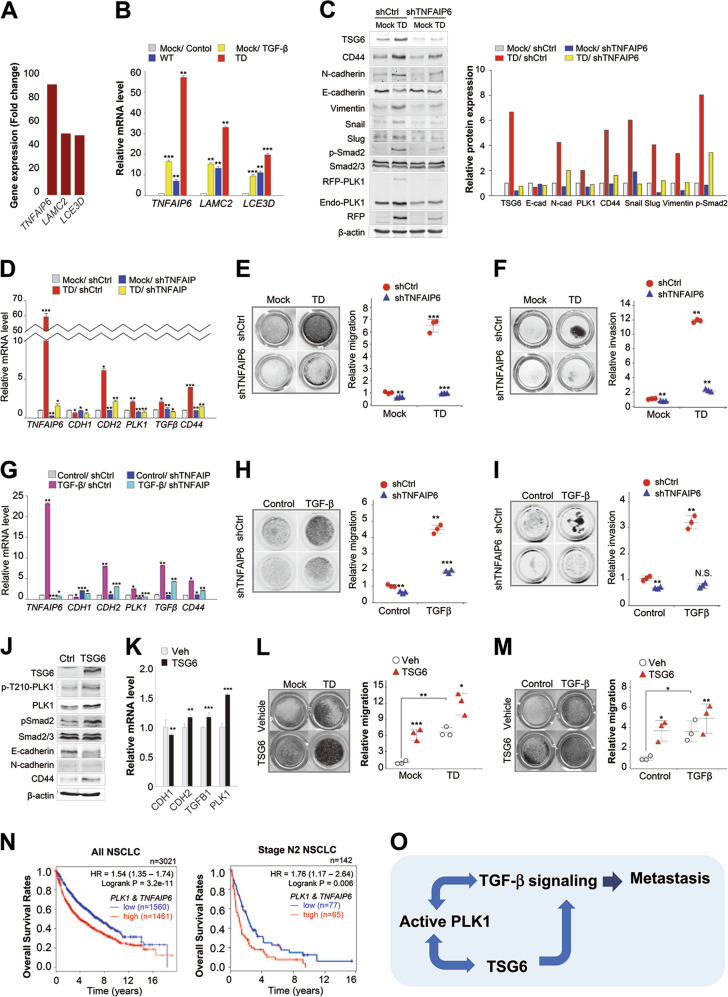
Fig. 6.
Depletion of TNFAIP6 reduces the metastatic activity induced by active PLK1 or TGF-β in NSCLC. a Relative gene expression profile of top three genes in invasive cells expressing TD, compared with non-invasive cells expressing TD. b qRT-PCR was performed for TNFAIP6, LAMC2, or LCE3D of invasive A549 cells expressing mock, WT, or TD-PLK1. TGF-β was used as a positive control for the EMT. **p < 0.01; ***p < 0.001. (n = 3). Data presented as mean ± SD. c–f A549 cells expressing mock or TD-PLK1 (TD) were depleted with shRNA targeting TNFAIP6. c Immunoblotting was performed using specific antibodies for TSG6, CD44, N-cadherin, E-cadherin, vimentin, snail, slug, smad2/3, p-smad2, PLK1, RFP, and β-actin (left panel). The band intensity values were quantified with LI-COR Odyssey software, normalized, and plotted (right panel). d qRT-PCR was performed for TNFAIP6, CDH1, CDH2, TGFB1, or CD44 in A549 cells expressing mock or TD-PLK1 depleting with shRNA targeting for TNFAIP6. *p < 0.05; **p < 0.01; ***p < 0.001. (n = 3). Data presented as mean ± SD. e A549 cells were subjected to a transwell migration assay. Three days after seeding, the cells on the bottom layer surface were stained with 0.05% crystal violet dye, and the intensity values were measured using an Odyssey infrared imaging system (LI-COR Biosciences) and plotted. **p < 0.01; ***p < 0.001. (n = 3). f A549 cells expressing mock or TD-PLK1 were depleted with shRNA targeting TNFAIP6 and subjected to an invasion assay. Seven days after seeding, the cells that had been invaded on the bottom layer surface were stained with 0.05% crystal violet dye, and the relative invasion was plotted. *p < 0.05; **p < 0.01; ***p < 0.001. (n = 3). g–i A549 cells depleted of TNFAIP6 were treated with TGF-β for 48 h. g qRT-PCR was performed for TNFAIP6, CDH1, CDH2, TGFB1, or CD44. *p < 0.05; **p < 0.01; ***p < 0.001. (n = 3). h A549 cells depleting TNFAIP6 were treated with TGF-β and subjected to a transwell migration assay. Three days after seeding, the cells on the bottom layer surface were stained with 0.05% crystal violet dye, and the intensity values were measured using an Odyssey infrared imaging system (LI-COR Biosciences) and plotted. **p < 0.01; ***p < 0.001. (n = 3). i A549 cells depleted of TNFAIP6 were treated with TGF-β and subjected to an invasion assay. Five days after seeding, the cells that had been invaded on the bottom layer surface were stained with 0.05% crystal violet dye, and the relative invasion was plotted. *p < 0.05; **p < 0.01; ***p < 0.001. (n = 3) NS, not significant. j TSG6-treated A549 cells were subjected to immunoblot analysis using specific antibodies for TSG6, PLK1, p-T210-PLK1, N-cadherin, E-cadherin, smad2/3, p-smad2, and β-actin. (n = 3). k qRT-PCR was performed for PLK1, CDH1, CDH2, or TGFB1 in TSG6-treated A549 cells. **p < 0.01; ***p < 0.001. (n = 3). Data presented as mean ± SD. l A549 cells expressing TD-PLK1 were treated with TSG6 and subjected to a transwell migration assay. The cells were stained with 0.05% crystal violet dye, and the intensity values were measured and plotted. **p < 0.01; ***p < 0.001. (n = 3). m A549 cells treating TGF-β were treated with TSG6 and subjected to a transwell migration assay. *p < 0.05; **p < 0.01. (n = 3). n Clinical association between PLK1 and TNFAIP6 in patients with lung cancer. The survival rate of NSCLC patients was analyzed according to the PLK1 and TNFAIP6 expression levels using KM PLOTTER in all NSCLC patients (n = 3021) or stage N2 NSCLC patients (n = 142). o Plausible model of PLK1-driven metastasis

