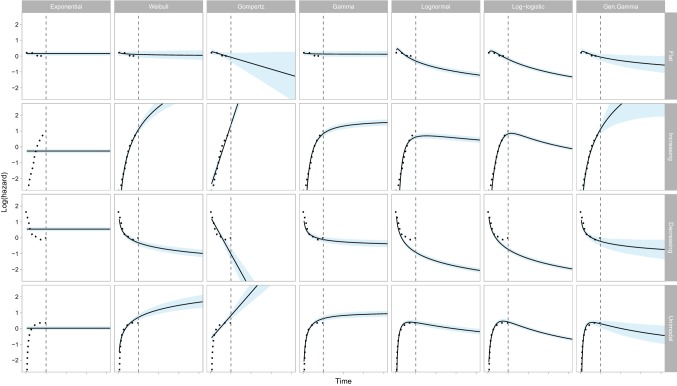
Fig. 2.
Visualisation of the estimated hazard (and 95% confidence interval) in the observed and extrapolated periods for seven commonly used statistical time-to-event models studied in four hypothetical datasets. The dotted line shows the observed (smoothed) hazard and the vertical dashed line denotes the end of the observed time period

