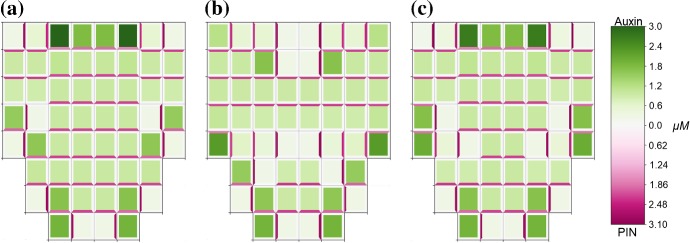
Fig. 11.
Influence of tissue growth on PIN polarisation contributes to the formation of ‘reverse-fountain’ auxin distribution patterns at the root tip. Numerical solution of model (1)–(4b) on a modified domain and different combinations of source and sink cells. a The central four cells in the top row are source cells, auxin flows from these cells to the base of the tissue with no flow from the base cells back up the tissue. b The outer four cells in the top row are sink cells, auxin flows from cells in the top five rows into these sinks, in the bottom three rows of cells auxin flows to the base of the tissue. c The central four cells in the top row are source cells and the outer four cells in the top row are sink cells, auxin flows from the source cells down the tissue, the central columns flow to the base of the tissue and the outer columns divert outwards to flow back up to the sink cells, resembling the reverse-fountain pattern observed at the root tip. Model parameters are described in Appendix Tables 2 and 3, with zero-flux boundary conditions. Cells are represented in the reference configuration (Color figure online)

