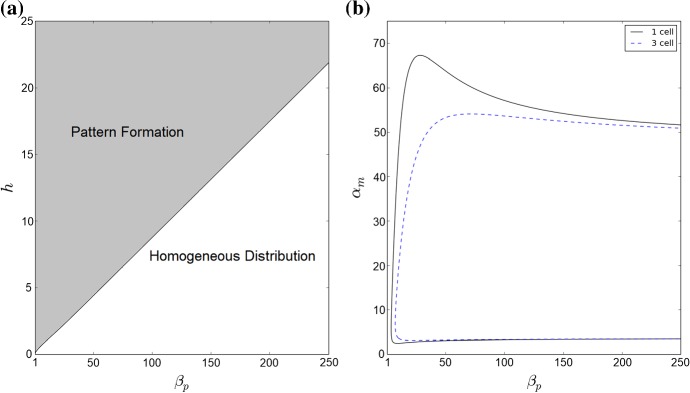
Fig. 4.
Analysis of parameter inference on solution types of model (1)–(3). a The boundary between pattern formation (shaded area) and homogeneous distribution (non-shaded area) is defined by an approximately linear relationship between h and . Minimum value of h presented here is 0.081. b As and are varied, model (1)–(3) undergoes a Hopf bifurcation and is able to have oscillatory solutions. For a single-cell model, i.e. , oscillatory solutions occur within the area bounded by the black solid line. For the three-cell geometry used for analysis model (1)–(3) are able to generate oscillatory solutions in the smaller area bounded by the dashed blue line (Color figure online)

