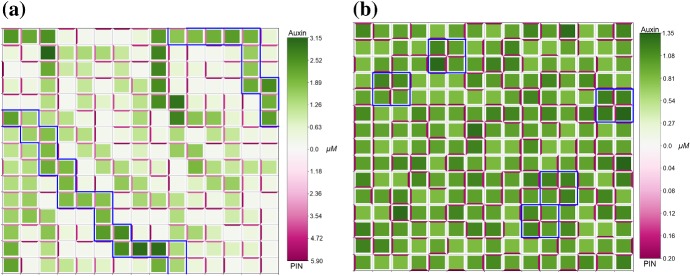
Fig. 5.
Mathematical model including auxin signalling can generate both passage- and spot-type patterns of auxin distribution. Numerical solution of model (1)–(3) on a regular lattice of cells with . Green colour represents the concentration of cellular auxin, darker shades correspond to higher concentrations. Magenta colour represents the concentration of membrane-bound PIN, darker shades correspond to higher concentrations. a for low values of the rate of PIN binding to auxin-TIR1 , here , passage patterns of auxin distribution are formed. b for higher values of , here , spot patterns of auxin distribution can be formed, here blue borders indicate spots. All other parameter values are described in Appendix Tables 2 and 3. Periodic boundary conditions were used for both simulations (Color figure online)

