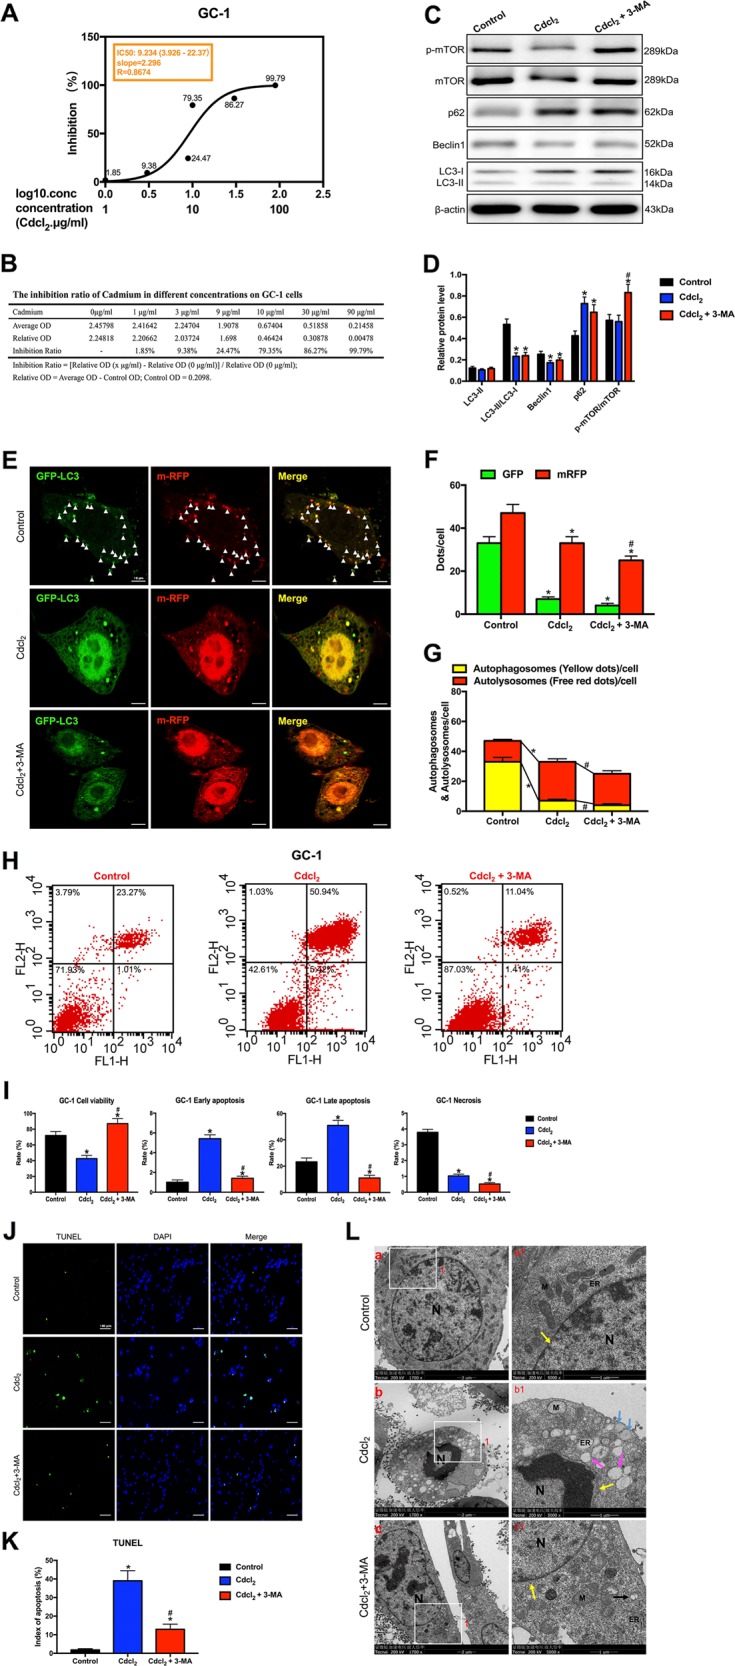
Fig. 4. Cd inhibited autophagy and induced apoptosis in GC-1 cells, and the PI3K inhibitor 3-MA protected against Cd-induced GC-1 cells apoptosis by partially aggravating the reduction of autophagic flow with mTOR-independent signaling.

a The IC50 of Cd for GC-1 cells. b The inhibition ratio of Cd at different concentrations on GC-1 cells. c, d A representative immunoblot and quantification analysis of LC3, p62, Beclin1, mTOR, and p-mTOR in GC-1 cells with or without 3-MA (60 μM) for 24 h. β-actin was used as an internal standard for protein loading. e GC-1 cells were transduced with Ad-tf-LC3 for 24 h and were subjected to Cd with 3-MA or without 3-MA for 24 h. Representative images of fluorescent LC3 puncta are shown. f Mean number of GFP and mRFP dots per cell. g Mean number of autophagosomes (dots with both red and green color, i.e., dots with yellow color in merged images) and autolysosomes (dots with only red and not green color, i.e., dots with red color in merged images) per cell. Adenovirus was transduced at 5 MOI. The results represent the means from at least three independent experiments. Scale bar, 10 μm. h Apoptosis of GC-1 cells was detected by flow cytometry. i Bar graphs illustrate the percentage of viable cells (Q3), early apoptosis (Q4), late apoptosis (Q2), and necrosis (Q1) as measured by Annexin V/PI staining. j The effect of Cd with 3-MA or without 3-MA on apoptosis of TUNEL-stained sections (200×). TUNEL-positive cells were stained and indicated by bright green fluorescence, which were deemed apoptotic cells, and normal nuclei were blue. Scale bar, 100 μm. k Quantification of TUNEL detection. l The effect of Cd with or without 3-MA on the ultrastructure of GC-1 cells was detected by transmission electron microscopy. Area 1 for the cell in the left column (Scale bar, 2 μm) have been shown for further detail in the right column (Scale bar, 1 μm). N cell nucleus; M mitochondria; ER endoplasmic reticulum; black arrowheads indicate early autophagic vacuoles; green arrowheads indicate typical autophagosomes containing intracellular components and organelles; orange arrowheads indicate late autolysosomes; blue arrowheads indicate lipid droplets; yellow arrowheads indicate nuclear membranes. *P < 0.05 compared with the control. #P < 0.05 compared with the Cd-treated group. N.S. not significant.
