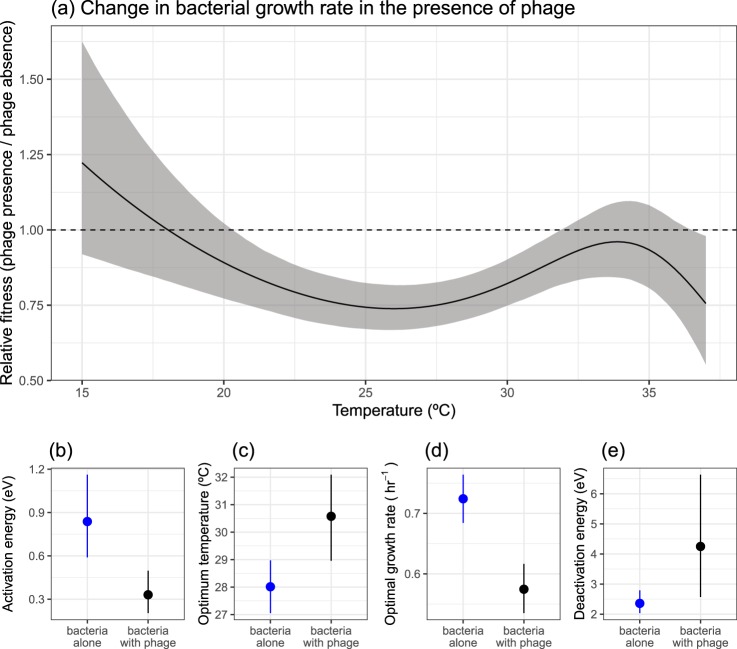
Fig. 2.
Effect of phage on the thermal performance of bacteria. a Phage altered the growth rate of bacteria (calculated as relative fitness) in a non-linear fashion with increasing temperatures. b–e The effect of phage on key thermal performance traits. Phage altered the b activation energy, c optimum temperature, d optimal growth rate and e deactivation energy. In a the solid line represents the mean prediction and shaded band represents the 95% credible interval of predictions. The dashed line at y = 1 would indicate that phage do not alter growth rate. Below 1, phage reduces the growth rate of the bacteria. In b–e points and lines represent the mean and 95% credible intervals of the estimated parameters

