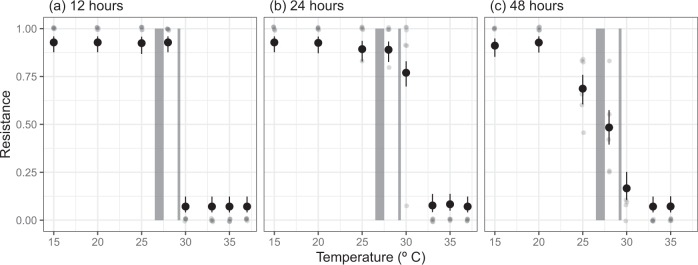
Fig. 3.
Levels of resistance of Pseudomonas fluorescens to phage through time and across temperatures. After 12 hr, populations were completely resistant at temperatures of 28 °C or lower. After 24 hr, most bacteria populations at 30 °C, close to the estimated critical thermal maxima (CTmax) of the phage, evolved resistance, but populations beyond the CTmax of phage infection remained susceptible. After 48 hr, at temperatures where phage impacted bacterial growth, intermediate levels of resistance were observed. Small points represent the observed level of resistance for a population. Large points represent the predicted levels of resistance (of transformed data [see Methods]) from a binomial regression with 95% confidence intervals. Shaded regions represent the upper and lower confidence intervals of the optimum temperature and critical thermal maxima of the phage

