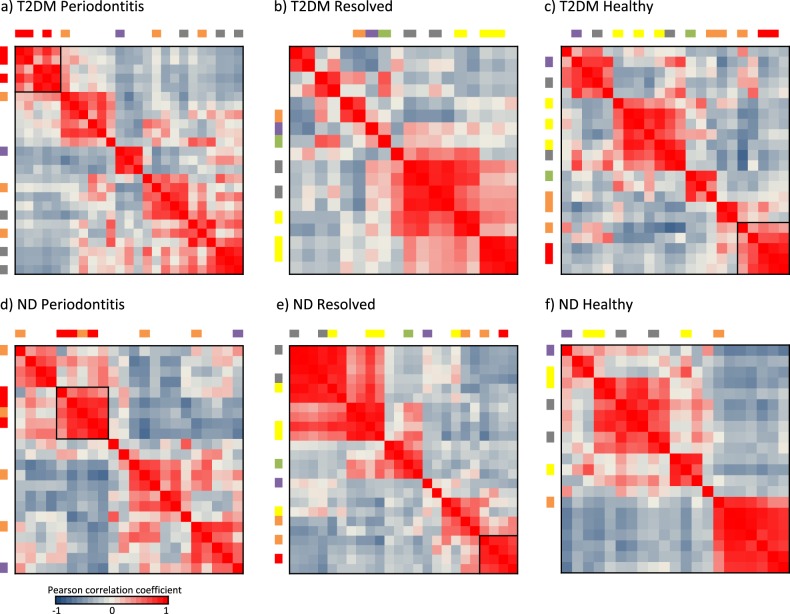
Fig. 4.
Correlations in relative abundance between subgingival species. The correlations in relative abundance among prevalent species (see list in Supplementary Table 1) were calculated based on Pearson correlation coefficients. In each heatmap, the species are listed in the same order in both horizontal and vertical axes, and the colored bars indicate the bacterial complexes based on Socransky’s designation [37] (more details in Supplementary Table 1). Black boxes in the heatmaps indicate the bacterial clusters that comprise red complex species with an average Pearson correlation coefficients >0.7 between the species. Hierarchical clustering was applied to the correlation matrices

