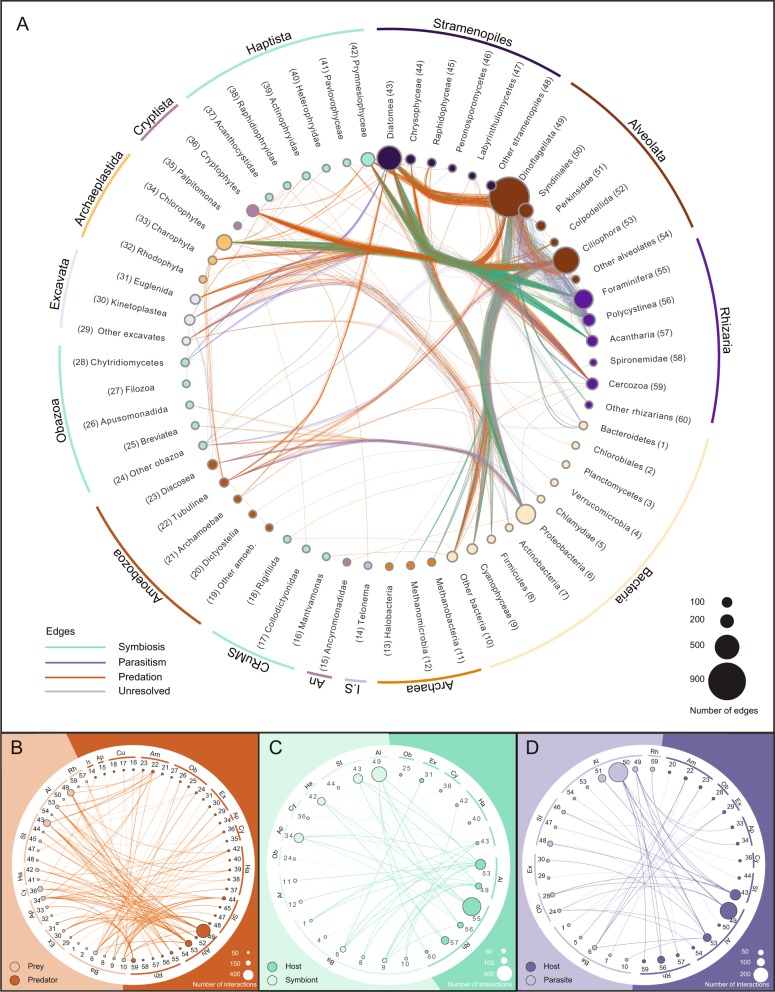
Fig. 1.
Overview of the interactions included in PIDA. Nomenclature and taxonomic order of Eukaryota is based on Adl et al. 2019 [25]. Nomenclature and taxonomic order of Bacteria is based on Schultz et al. 2017 [87]. The nodes are grouped (outer circle) according to eukaryotic supergroups (or Incertae sedis), Bacteria and Archaea. a Network based on the 2422 entries in PIDA. Nodes represent eukaryotic and prokaryotic taxa and are colored accordingly. Node size indicates the number of edges/links that are connected to that node. Each node/taxon is assigned a number, which corresponds with the numbers for taxa in b–d. Edges represent interactions between two taxa and are colored according to ecological interaction type: predation (orange), symbiosis (green), and parasitism (purple). The network is undirected, meaning that a node can contain both parasites/symbionts/prey and hosts/predators. To avoid cluttering of the figure, ‘Self-loops’, which represent cases where both interacting organisms belong to the same taxon (e.g., a dinoflagellate eating another dinoflagellate) are not shown as edges/links in this figure, but are considered in the size of nodes. The outermost circle groups taxa in the different eukaryotic ‘supergroups’ or the prokaryotic domains Bacteria and Archaea. Ancryomonadidae is abbreviated An. Telonema is not placed into any of the supergroups, but classified as Incertae sedis (abbreviated I.S. in the figure). In b, c, and d the following abbreviations for supergroups are used: Ar Archaea, Ba Bacteria, Rh Rhizaria, Al Alveolata, St Stramenopiles, Ha Haptista, Cy Cryptista, Ap Archaeplastida, Ex Excavata, Ob Obazoa, Am Amoebozoa, Cu CRuMS, An Ancryomonadidae, Is Incertae sedis. b Predator–prey interactions in PIDA. The node numbers correspond to taxa node numbers in a. Abbreviations for supergroups are described above. Background and nodes are colored according to functional role in the interaction: Prey are colored light orange (left part of figure), while predators are depicted in dark orange (right part of figure). The size of each node represents the number of edges connected to that node. c Symbiont–host interactions included in PIDA. The node numbers correspond to node numbers in a. Abbreviations for supergroups are described above. Symbionts are to the left, colored light green, and their hosts are to the right in dark green. The size of each node represents the number of edges connected to that node. d Parasite–host interactions included in PIDA. The node numbers correspond to node numbers in a. Abbreviations for supergroups are described above. Parasite taxa are depicted in light purple (left), hosts in dark purple (right). (The unresolved interactions are shown in Supplementary Fig. 7)

