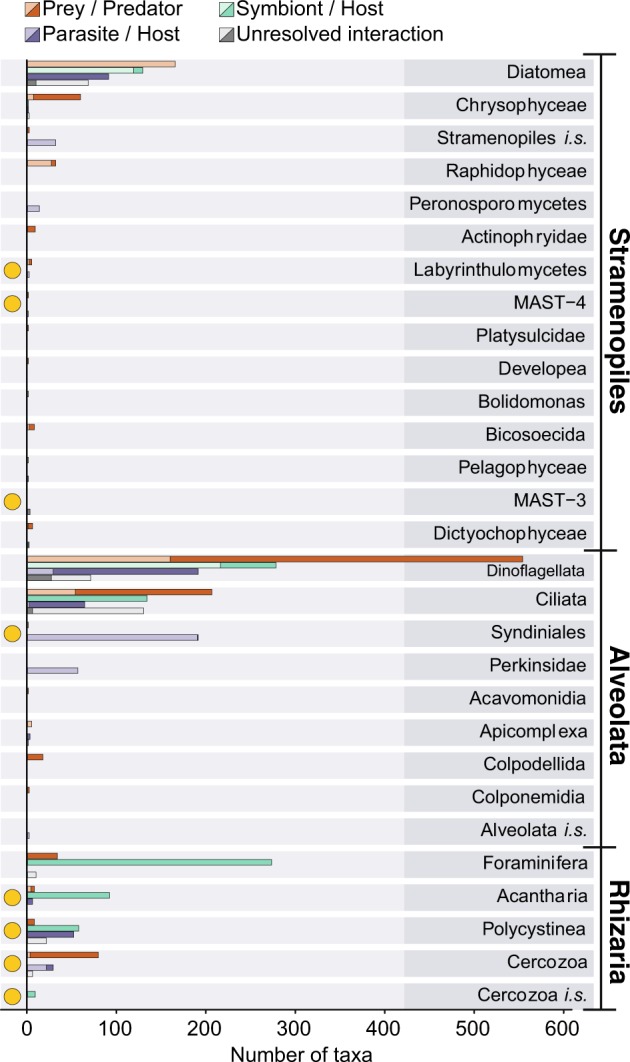
Fig. 5.

The dominating SAR supergroup. Number of interactions registered in PIDA belonging to the SAR supergroup (Stramenopiles, Alveolates, and Rhizaria). For each of the SAR supergroups the entries of the different taxonomic groups at ‘phylum level’ are shown (corresponding to the third taxonomic level in PIDA). Red bars show predators, green represent symbiosis, purple parasitism, and gray unresolved interactions. Solid colors represent host/predator and transparent colors represent prey/symbiont/parasite/interactor. Yellow circles highlight the ‘phyla’ that comprise few records in PIDA compared with the (hyper)diversity these ‘phyla’ represent in environmental HTS studies, such as the Tara Oceans study [45]. Abbreviations used in this figure: i.s. refers to Incertae sedis or unknown
