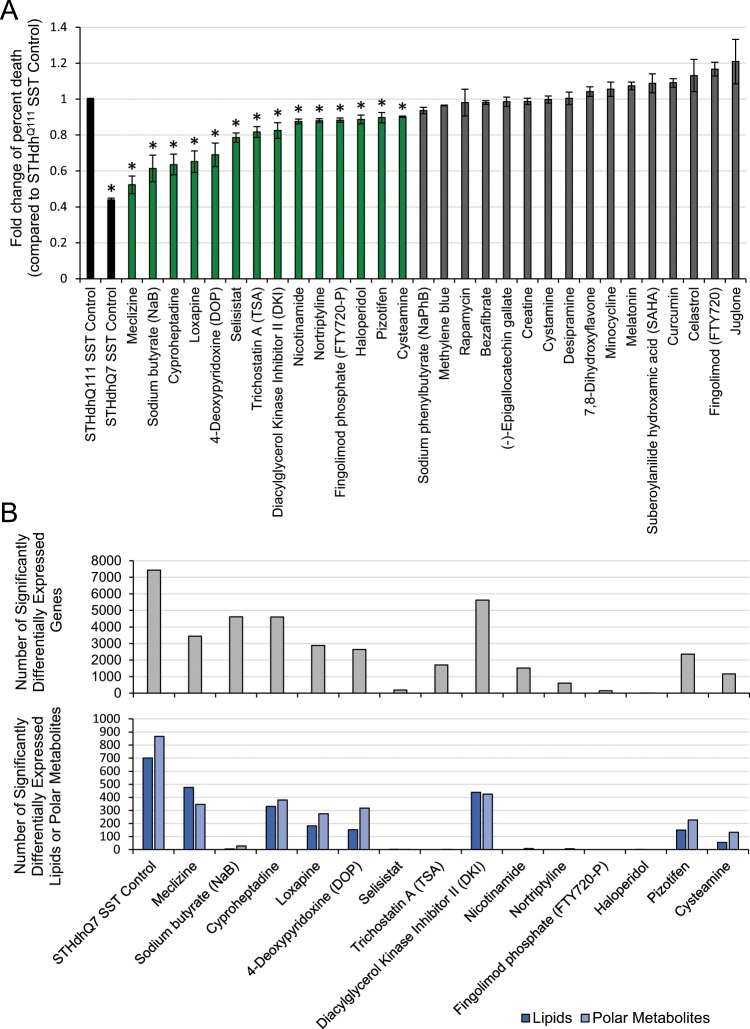
Figure 2.
Compounds have diverse effects on viability, gene expression, and metabolite expression in the STHdhQ111 cell model. (A) Cell viability assay categorizes 14 compounds as protective and 16 as unprotective. Data are represented as mean ± SD. *p-value < 0.001. The black, green, and gray bars indicate controls, protective compounds, and unprotective compounds, respectively. (B) The number of transcriptomic and metabolomic changes in compound-treated cells compared to controls.

