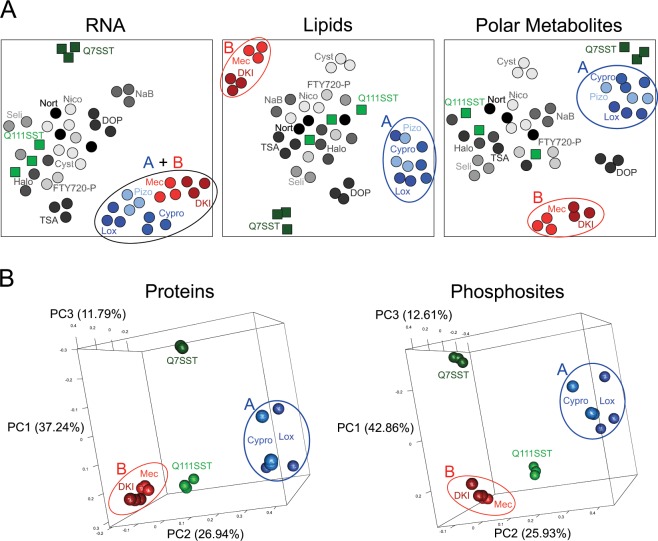
Figure 3.
Omics profiles reveal unexpected similarities between compounds. (A) Clustering of metabolite profiling data reveals two distinct groups of compounds that are inseparable in the gene expression data, as displayed in t-SNE plots. The blue and red ellipses indicate the Group A and Group B compounds, respectively. Q7SST = STHdhQ7 SST control; Q111SST = STHdhQ111 SST control; Mec = meclizine; NaB = sodium butyrate; Cypro = cyproheptadine; Lox = loxapine; DOP = 4-deoxypyridoxine; Seli = selisistat; TSA = trichostatin A; DKI = diacylglycerol kinase inhibitor II; Nico = nicotinamide; Nort = nortriptyline; FTY720-P = fingolimod phosphate; Halo = haloperidol; Pizo = pizotifen; Cyst = cysteamine. (B) Clustering of proteomic data, as shown in three-dimensional PCA plots. See also Figs S1–S3, Tables S2–S6.

