Figure 5.
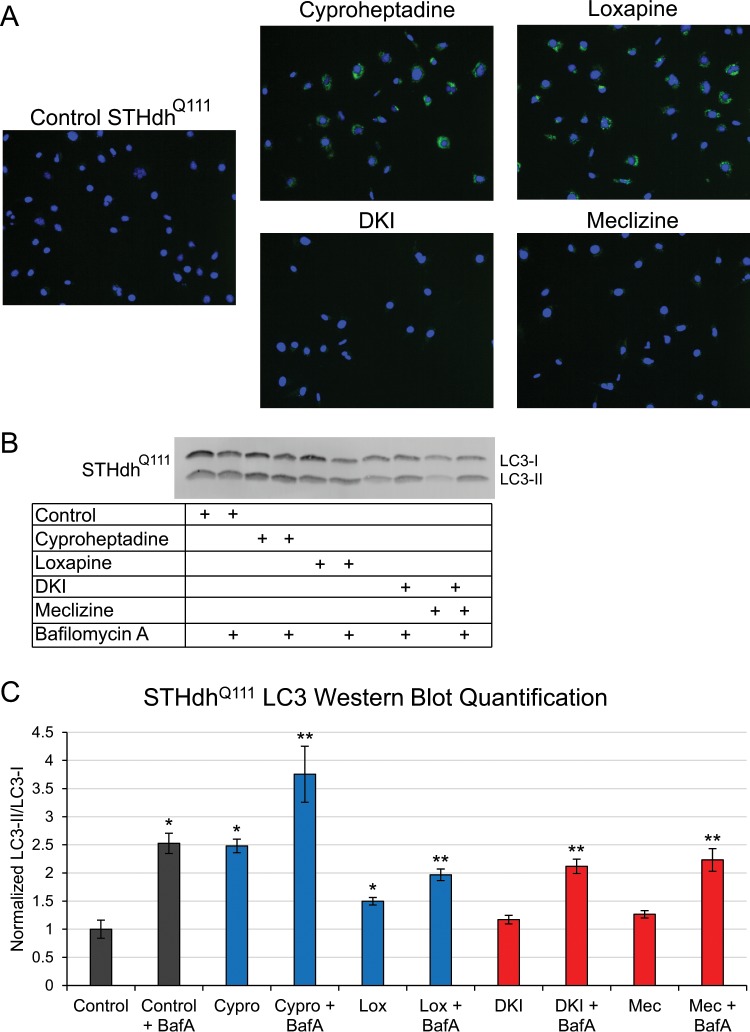
Autophagy is up-regulated by Group A compounds in murine STHdhQ111 cells. (A) Fluorescent staining of autophagic vacuoles in Group A compound-treated cells compared to Group B compound-treated or control cells. Blue fluorescence indicates nuclei and green fluorescence indicates autophagic vacuoles. (B) A representative western blot showing LC3-II and LC3-I levels to determine how the compounds affect autophagy. BafA was used to determine whether the compounds activate autophagy or inhibit vacuole degradation. The full-length western blot is presented in Fig. S5A. (C) Quantification of the LC3-II to LC3-I ratio normalized to the control from the western blot. Data are represented as mean ± SD. *p-value < 0.05 compared to Control; **p-value < 0.1 compared to condition-matched non-BafA treatment.

