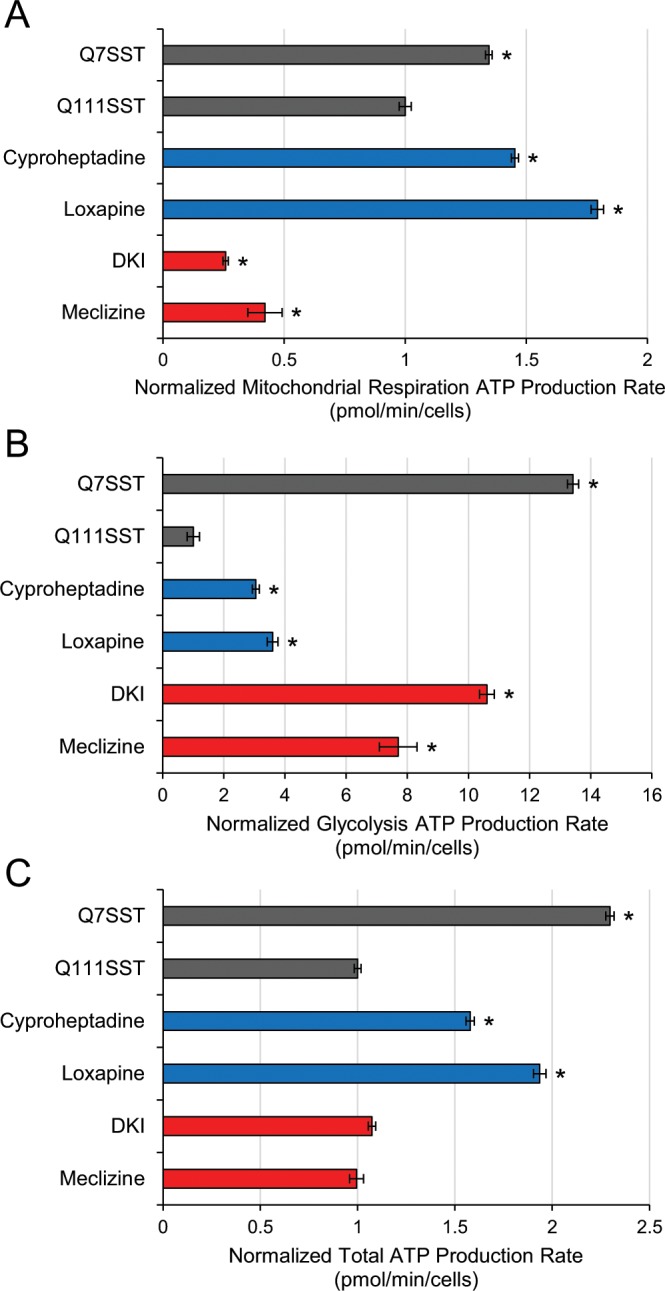
Figure 7.

Bioenergetics are altered differently by Group A and Group B compounds in STHdhQ111 cells. (A) Quantification of the mitochondrial respiration ATP production rate normalized to the STHdhQ111 control. (B) Quantification of the glycolysis ATP production rate normalized to the STHdhQ111 control. (C) Quantification of the total ATP production rate normalized to the STHdhQ111 control. Data are represented as mean ± SEM. *p-value < 0.05.
