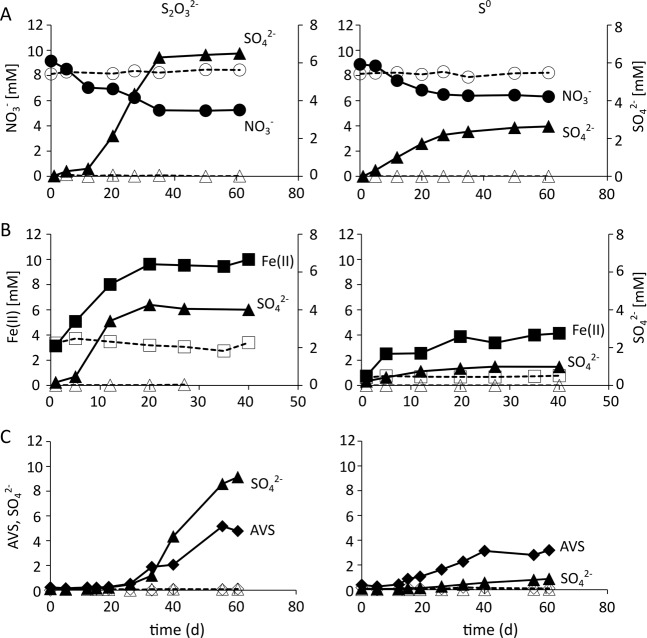
Fig. 2.
Development of concentrations of electron acceptor and sulfur species in the 1MN culture. Active cultures (filled symbols, solid lines) supplied with thiosulfate (left panel) or elemental sulfur (right panel) and electron acceptors a nitrate, b ferrihydrite, or c at disproportionation conditions in comparison to abiotic controls (open symbols, dashed lines). Concentrations of nitrate (circles), Fe(II) (squares), sulfate (triangles), and acid-volatile sulfides (AVS, diamonds) of one representative incubation is shown over the course of the experiment. Graphs of other replicate incubations are shown in Fig. S1

