Figure 3.
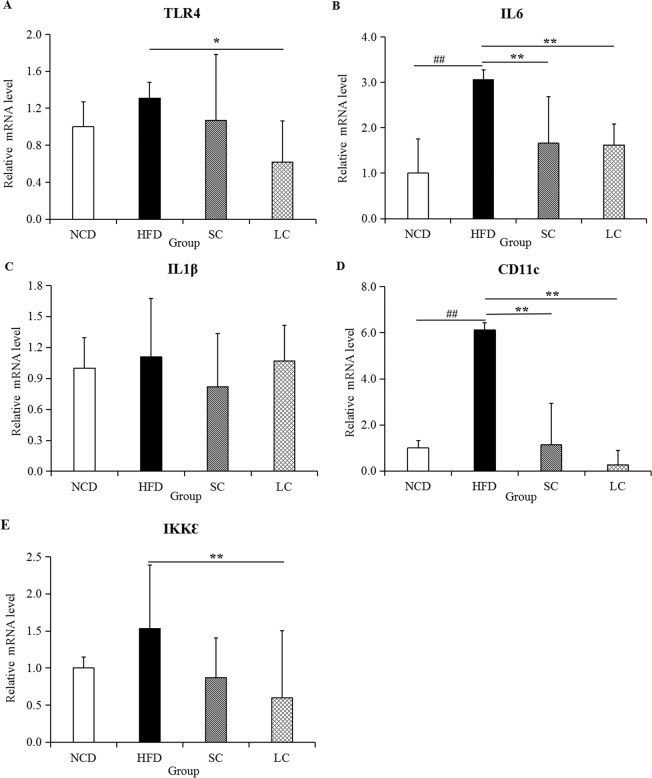
Expression of inflammatory cytokines, including (A) TLR4, (B) IL6, (C) IL1β, (D) CD11 and (E) IKKε, in epididymal adipose tissue. Data are represented as the mean ± SD (n = 7). #p < 0.05, ##p < 0.01, comparisons between the HFD and NCD groups; *p < 0.05, **p < 0.01, comparisons among the HFD, SC and LC groups. NCD, normal chow diet; HFD, high-fat diet; SC, high-fat diet plus short-chain inulin; LC, high-fat diet plus long-chain inulin.

