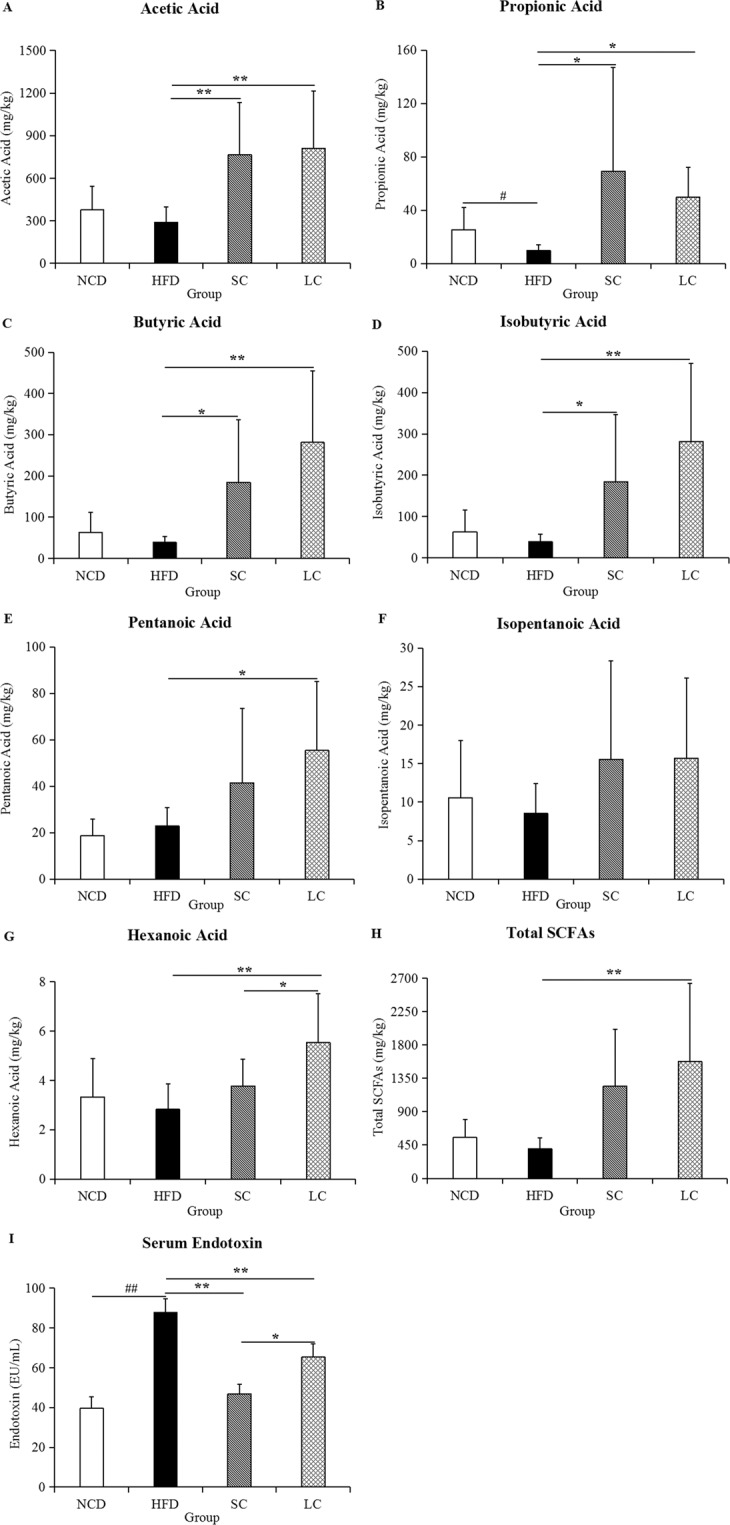
Figure 4.

The levels of SCFAs in feces and endotoxin in serum. (A) Acetic acid, (B) propionic acid, (C) butyric acid, (D) isobutyric acid, (E) pentanoic acid, (F) isopentanoic acid, (G) hexanoic acid, (H) total SCFAs, and (I) endotoxin. Data are represented as the mean ± SD (n = 10). #p < 0.05, ##p < 0.01, comparisons between the HFD and NCD groups; *p < 0.05, ** p < 0.01, comparisons among the HFD, SC and LC groups. NCD, normal chow diet; HFD, high-fat diet; SC, high-fat diet plus short-chain inulin; LC, high-fat diet plus long-chain inulin.
