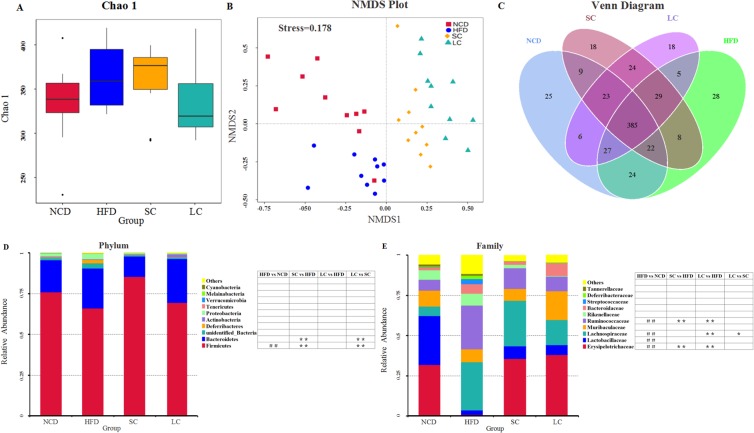
Figure 5.
Microbial community analysis. (A) Chao 1, (B) nonmetric multidimensional scaling (NMDS), (C) Venn diagram, (D) relative abundance of the top ten phyla, (E) relative abundance of the top ten families. n = 10 per group. #p < 0.05, ##p < 0.01, comparisons between the HFD and NCD groups; *p < 0.05, **p < 0.01, comparisons among the HFD, SC and LC groups. NCD, normal chow diet; HFD, high-fat diet; SC, high-fat diet plus short-chain inulin; LC, high-fat diet plus long-chain inulin.

