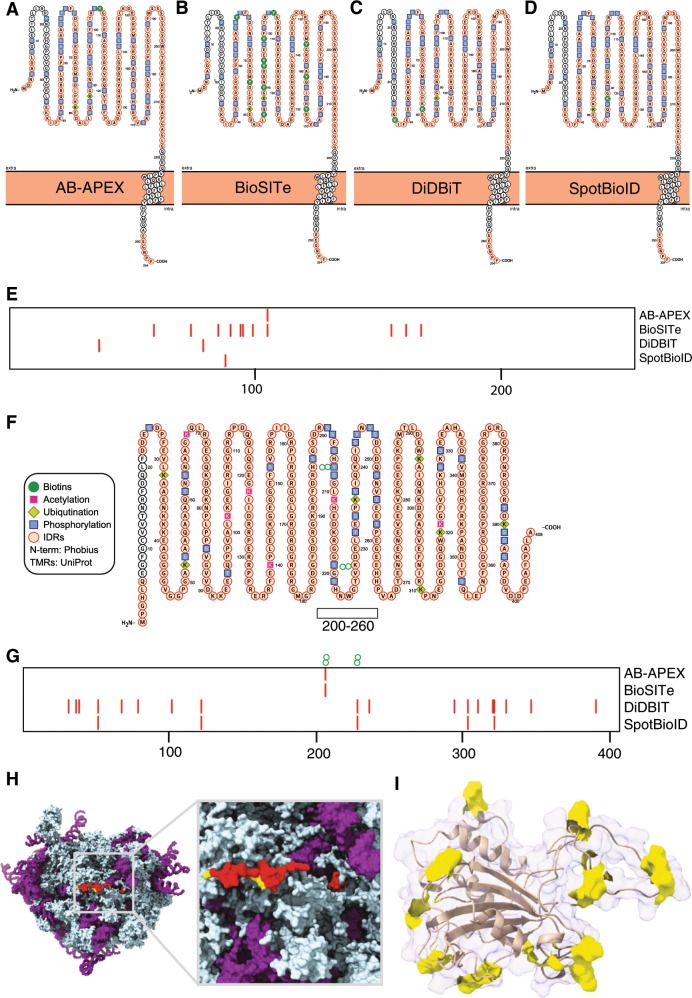
Fig. 2. Illustrative examples for in vivo surface biotinylation in four independent studies.
Emerin: a–d Protter55 representations of regions of IDR (orange), frequent PTMs and biotin modification in the four studies e comparison of biotinylation sites across four studies.SERBP1: f Protter plot showing post-translational modifications and regions of IDR (orange) g sites of biotinylation across four studies h Cryo-EM model (PDB ID 4V6X56) of SERBP1 with sites of biotinylation across all studies highlighted in yellow and the cryo-EM resolved fraction (~20%, most coil and α-helix) of SERBP1 highlighted in red. (RNA is denoted in purple) i FKPB3 NMR structure (PDB ID 2mph) with biotinylations in yellow, non-biotinylated chains are represented in cartoon style under 90% transparent surface. Note that the legend in f also applies to (a–d).

