Fig. 3.
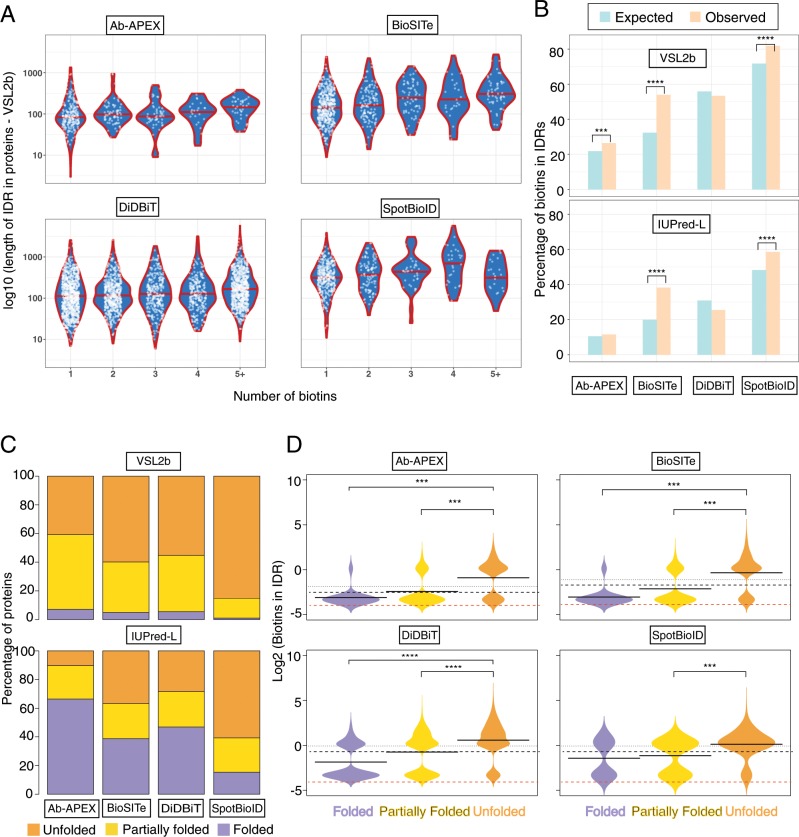
Predicted IDRs are preferentially in vivo biotinylated across all studies a Violin plots (i.e. mirrored density distribution plots) showing the relationship between number of biotins and length of IDR across all biotinylated proteins. Biotin numbers > = 5 are grouped into one set to show the general trend of the data. The red line in the middle of each violin represents the median fraction of IDR for that group. b Barplots showing the Expected (pale blue) and Observed (pale orange) distribution of biotins within regions of IDR across the 4 studies using the IDR caller VSL2b (Top) and IUPred-L (bottom). Significance: ***p < 0.0005; ****p close to 0, using a binomial test where the “probability of success” is the (number of lysine residues or tyrosine residues in IDRs/Total number of lysine residues or tyrosine residues), a “success” is a biotin within an IDR and “number of trials” is the number of biotins observed in that study. c Barplots showing the distribution of proteins from the four studies across the three structural classes19: Folded (F, 0–10% disorder; purple); Partially Folded (P, 10–30% disorder; Yellow) and Unfolded (U, >30% disorder; orange) for two different IDR callers VSL2b (Top) and IUPRed-L (bottom). The numbers of proteins in the VSL2b caller are displayed in Supplementary Fig. 2b. We note that disorder classifications vary substantially with specific predictors, which is expected given their differences in precision and recall. At least for SpotBioID, all tested prediction tools indicate that most sites of biotinylation map to partially folded or unfolded proteins. d Bean-plots58 showing the distribution of biotins that occur within VSL2b predicted IDRs across the 3 classes F, P, U in each study. The y-axis in on a log2 scale with values 0 and above representing 1 or more biotins. The red dotted line represents 0 biotins (with added correction factor). The solid black line in the middle of each violin represents the mean biotins (on log2 scale) for that group. The black dotted line represents the mean log2(Biotins) across all groups.

