Fig. 1.
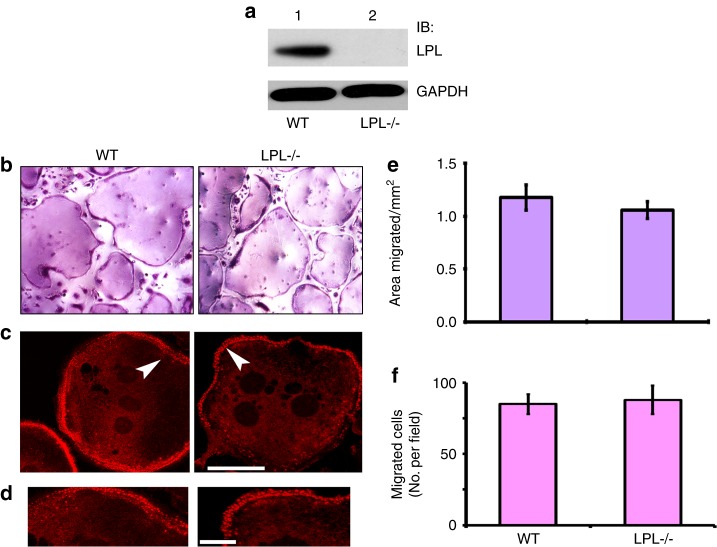
Characterization of LPL−/− osteoclasts. a Immunoblotting (IB) analysis with an L-plastin antibody. Equal amount of lysate proteins made from WT and LPL−/− osteoclasts were used for IB with an antibody to LPL. IB with a GAPDH antibody served as a loading control. b Osteoclast differentiation in vitro from the bone marrow cells isolated from the long bones of WT and LPL−/− mice. Representative images of TRAP-stained osteoclasts are shown. Cells were viewed under ×20 objective in a phase contrast microscope and photographed. Magnification is ×200. c, d Osteoclasts plated on coverslips were stained for actin with rhodamine-phalloidin. A magnified single osteoclast from WT (left) and LPL−/− (right) mice demonstrating the dot-like podosome structures at the cell periphery is shown in c. Areas pointed by arrowheads in c are magnified in d. Scale bar: 100 µm in c; 25 µm in d. e, f Phagokinesis and transwell migration analyses. e Phagokinesis assay: the motility of the cell is represented as areas migrated in mm2. Results are shown as mean ± SD (n = 3). f Transwell migration assay: all assays were performed in triplicates. Experiments were repeated three times with three different osteoclast preparations. Data are presented as the number of cells per migrated field (error bars represent SD) of the three experiments performed. Data were assessed using Student’s t test.

