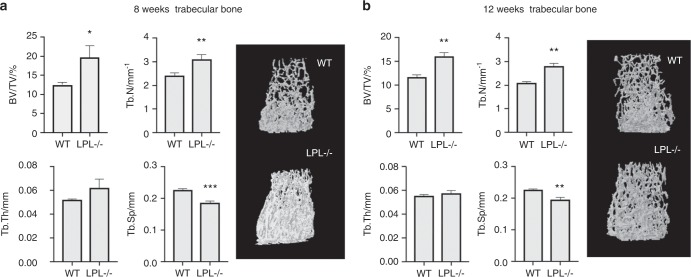
Fig. 6.
Micro-CT analysis of the trabecular compartment of wild-type and LPL−/− mice. Trabecular bone microarchitecture was assessed by micro-CT at the distal femoral metaphysis of (a) 8- or (b) 12-week-old wild-type or LPL−/− female mice by micro-CT (n = 5–6 mice per group). Trabecular bone volume fraction (BV/TV), trabecular number (Tb.N), trabecular thickness (Tb.Th), and trabecular spacing (Tb.Sp) are shown. Data are mean ± SD. *P < 0.05; **P < 0.01; ***P < 0.001 vs. WT mice. Statistical analysis was performed using Student's t test. A representative image of the trabecular bone in the ROI is shown for each genotype.

