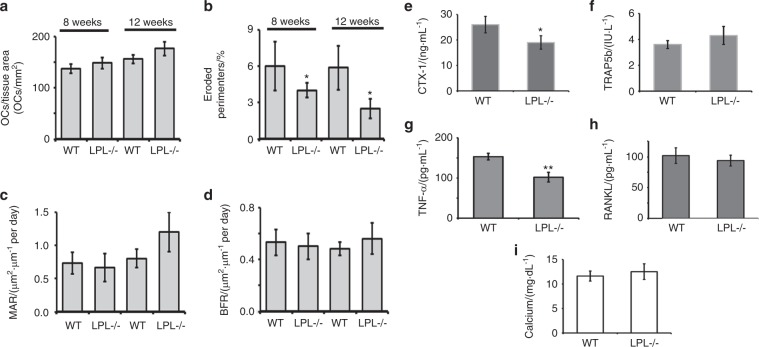
Fig. 7.
Comparison of the histomorphometric parameters and factors that regulates bone modeling in WT and LPL−/− mice. a–d Histomorphometric assessments of indicated bone parameters are provided as bar graphs. Other parameters are provided in the Supplementary Fig. S7 and Table S1. Analyses were done twice. Each time 5–7 mice were used for each group. Data shown are mean ± SEM; *P < 0.05; **P < 0.01 vs. WT mice. e–i Comparison of serum levels of indicated biomarkers of bone formation and resorption in WT and LPL−/− mice. CTX-1 (e), TRAP (f), TNF-α (g), RANKL (h), and Calcium (i), were measured by ELISA in the serum of 12-week-old WT and LPL−/− mice. The data represent mean ± SEM of 5–6 mice per group (n = 2). *P < 0.05; **P < 0.01 vs. mice. P values were assessed by standard Student’s t test.

