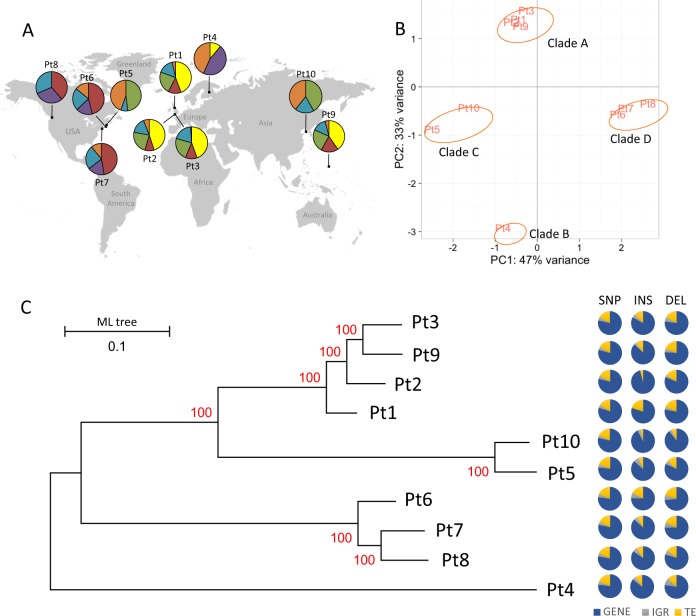
Fig. 2.
Clustering of P. tricornutum accessions. a Principal component analysis (PCA) showing the distribution of the ten accessions based on their shared genome structure, revealing four genetic clusters referred to as clades A, B, C, and D. b Pie charts showing the genetic makeup of the genomes of each accession. Based on the allelic composition of the ten genomes, six genomic clusters (K = 6) are formed, which are distributed across individual accession genome in different proportions (represented by six different colors in the pie-chart). c Phylogenetic association of the accessions based on 468,188 genome-wide polymorphic sites (including SNP and INDELS) using a maximum likelihood approach. The numbers on the branches indicate the bootstrap values. Pie charts adjacent to each node of the whole genome tree correspond to the proportion of SNPs and INDELs over all functional features of the genome; GENEs (blue), TEs (yellow), IGRs (Intergenic Regions, represented in gray)

