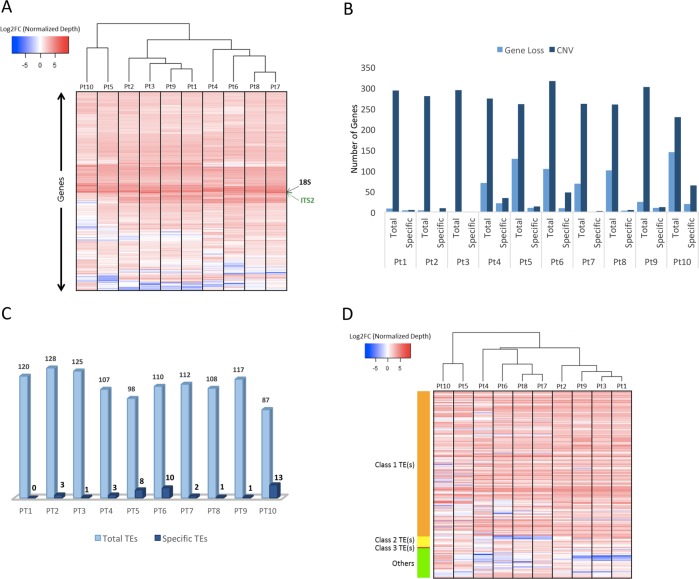
Fig. 3.
Large structural variations within accessions. a The heat-map displays the fold change (FC) of read depth between each reference gene and median of read depth of all the reference genes, within each accession. Using Z-score as a measure of normalized read depth, log2 fold change (FC) is calculated as a ratio of Z-score per gene to the average normalized read depth of all the genes per accession. A blue to red color gradient in the heat-map represents low to high log2FC. From all the accessions only those genes are plotted where log2FC is more than 2 in at least one of the accessions and are considered to exhibit copy number variation (CNV). b The bar plots represent the total and specific numbers of genes, denoted on the Y-axis, that exhibit a loss or multiple copies (CNV) within one or more accessions. c The bar plots represent the number of total- and accession-specific TEs exhibiting CNVs across one or more accessions. d With similar principle esthetics as a of this figure, the heat-map shows the patterns of log2FC only across all the accessions of those TEs exhibiting CNV in at least one of the ten accessions studied

