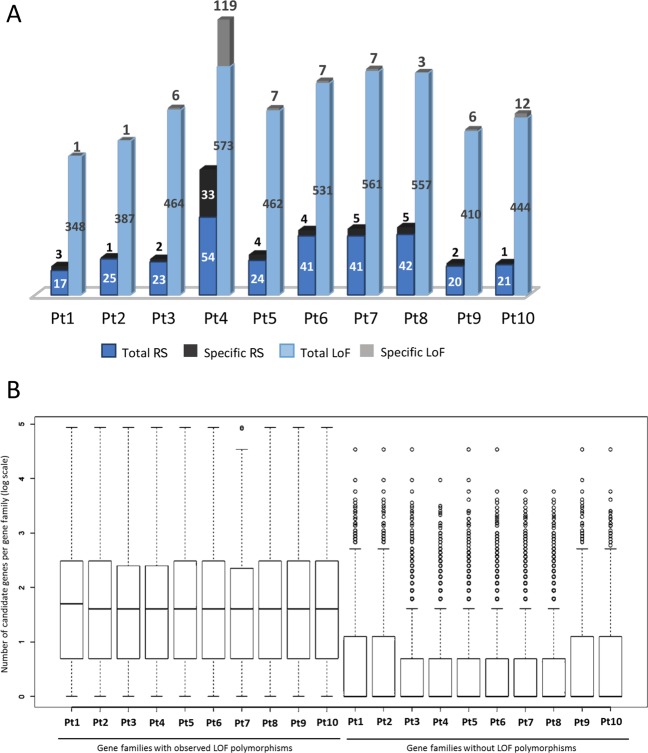
Fig. 4.
Evolutionary and functional consequences of polymorphisms. a The bar plot represents total and specific numbers of genes that are subject to relaxed selection, or experiencing loss-of-function (LoF) mutations. For each category, the accessions are plotted as stack plots with total and specific numbers of genes. Numbers of genes in each category are indicated. b The box plot represents the number of gene families affected by loss-of-function (LoF) mutations and suggests a bias of such mutations on the genes belonging to large gene families. The Y-axis represents, as log scale, the number of genes in the gene families vs those that are not affected by LoF mutations

