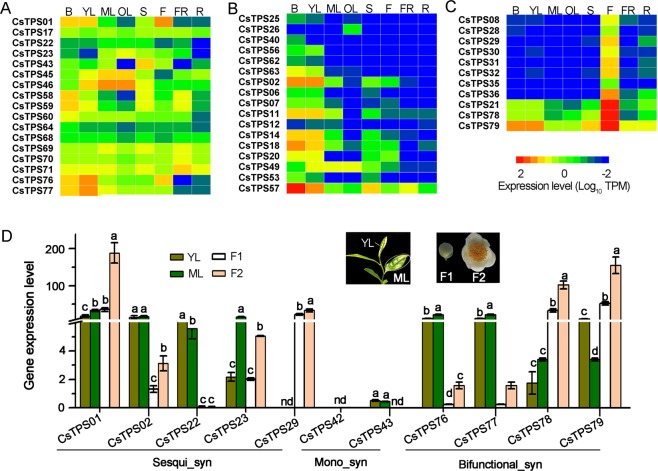
Figure 3.
Tempo-spatial expression patterns of CsTPS genes in tea apical buds (B), young leaves (YL), mature leaves (ML), old leaves (OL), immature stems (S), flowers (FL), young fruits (FR) and roots (R). (A), CsTPS genes substantially expressed in eight tested organs with a few exceptions; (B), CsTPS genes predominantly expressed in leaves; (C), CsTPS genes primarily expressed in flowers; Transcripts per million (TPM) were used to evaluate gene expression levels; (D) qRT-PCR validation of transcriptomic data of the CsTPS genes in red in young and mature leaves (YL and ML) and flowers at the two developmental stages (F1 and F2) relative to the level of CsTPS02 in F1. Mean levels (n ≥ 3) distinguished with different letters for each gene among different leaves and flowers are significantly different from each other (p < 0.05). Sesqui-syn, Mono-syn, and Bifunctional-syn represent sesquiterpenoid synthase, monoterpenoid synthase and bifunctional ternpenoid synthase, respectively.

