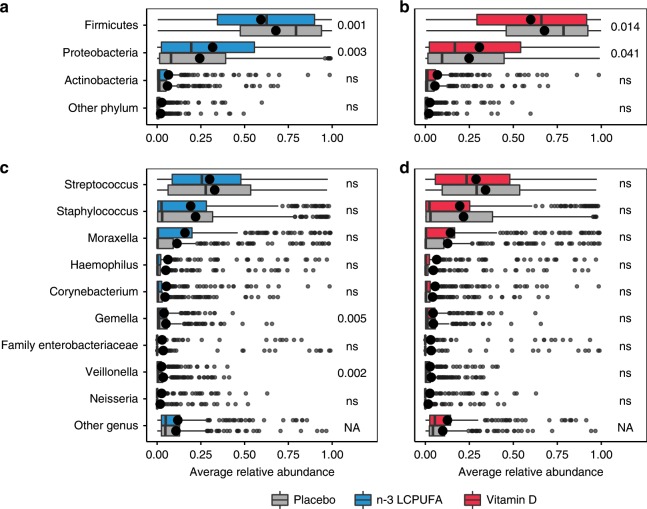
Fig. 2. Relative bacterial abundances stratified by intervention groups for the 1-month airway samples.
Relative abundances are shown at the phylum-level (a and b), and genus-level (c and d). The three most abundant phyla and nine most abundant genera are shown. Phylum level DA statistics were performed using Wilcoxon rank sum test and genus level DA using the metagenomeseq feature model. Boxplots with first and third quartiles corresponding to the lower and upper hinge, the median represented by a vertical line, the mean by a black dot, upper/lower whiskers extend to the largest/smallest value no further than 1.5 * inter-quartile range (IQR) from the hinge, and outliers are shown as gray circles. In bold are crude p-values reaching FDR corrected significance at level 0.1. n = 653 and 541 independent samples for the n-3 LCPUFA (a + c) and Vitamin D (b + d) plot, respectively. Source data are provided as a Source Data file.

