
Fig. 3. Ordination of 1-month airway samples stratified by intervention group.
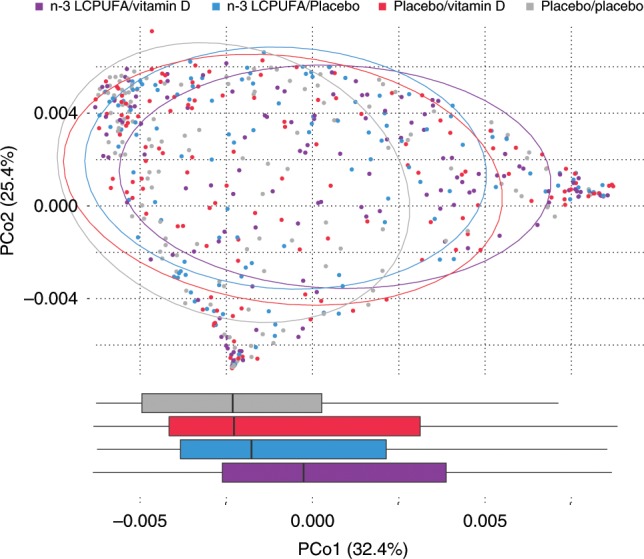
An additive effect is apparent in the right shift observed over PCo1 as samples are subject to either (n-3 LCPUFA/placebo (n = 125), or placebo/vitamin D (n = 141)) or both prenatal dietary interventions (n-3 LCPUFA/vitamin D (n = 131)) compared to double-placebo (placebo/placebo (n = 144)) (p < 0.001, Wilcoxon rank sum test). Boxplots represent the PCo1 values of each intervention group with first and third quartiles corresponding to the lower and upper hinge, the median represented by a vertical line, and the upper/lower whiskers extend to the largest/smallest value no further than 1.5 * inter-quartile range (IQR) from the hinge. Source data are provided as a Source Data file.