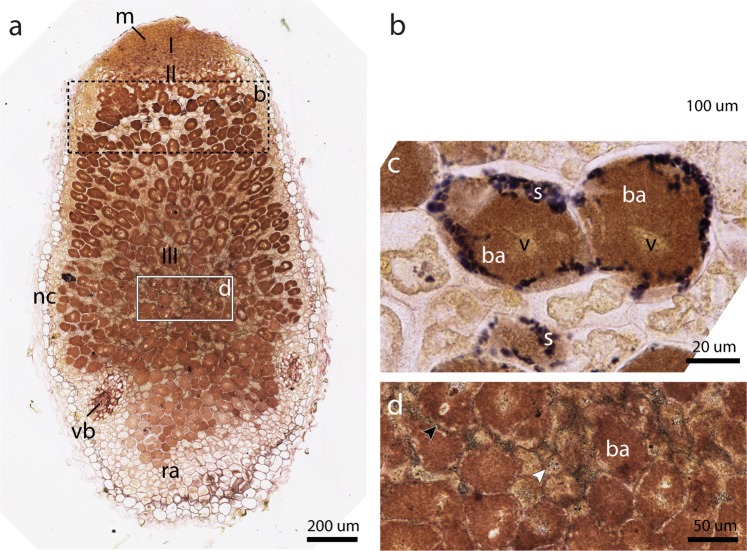
Figure 4.
Optical microscopy of root nodules reveals multiple starch distribution patterns. Coupes were stained with both Lugol’s solution and Toluidine blue. (a) A section immediately adjacent to that of Fig. 3c reveals starch distribution throughout the nodule. 10x magnification, scale bar 200 µm. A black dotted rectangle indicates the zone shown in (b) on an alternate section. A white rectangle indicates an enlargement seen in (d). 10x magnification, zoomed; scale bar 50 µm. (b) At the first layer of cells in zone III, starch is present as a band (s). A white rectangle indicates the area shown in (c). Alternate section, 20x Magnification, scale bar 100 µm. (c) Starch granules (s) are located near the periphery of infected cells. The vacuole (v) reappears in the fixation zone after disorganisation in the infection zone. (b). 40x Magnification, scale bar 20 µm. (d) A fine distribution of starch granules can be seen in Zone III contained in nitrogen fixating cells (black arrowhead) and uninfected cells (white arrowhead). Abbreviations: ra, root attachment site; nc, nodule cortex; vb, vascular bundles; m, meristem; s, starch granules; v, vacuole; ba, bacteroids.

