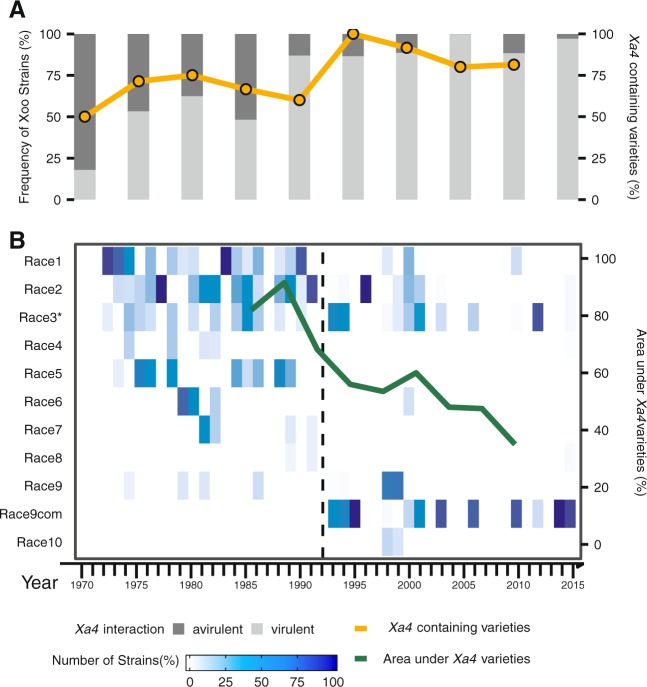
Fig. 1.
Historical frequency of Xanthomonas oryzae pv. oryzae (Xoo) outbreaks in the Philippines in response to Xa4 deployment during 45 years. a A bar chart centered on the proportion of Xoo strains that shows virulent (light gray) or avirulent (dark gray) phenotypes on Xa4. The orange solid line constitutes the percentage of released rice varieties containing Xa4 in the Philippines. b A heat map based on the distribution of races collected from 1970 to 2015. The green solid line embedded in the heat map indicates the percentage of area planted with Xa4-containing rice varieties from 1985 to 2009 [12]. Furthermore, the dashed black line describes the emergence of Race 9com as the most prevalent race after 1992. Race 9com represents different subgroups: 9a, 9b, 9c, and 9d [66]. The asterisk in Race 3 signifies genetically different populations with the same phenotypic reaction [72]. Phenotypic information from 1822 Xoo strains was used (Additional Data S2)

