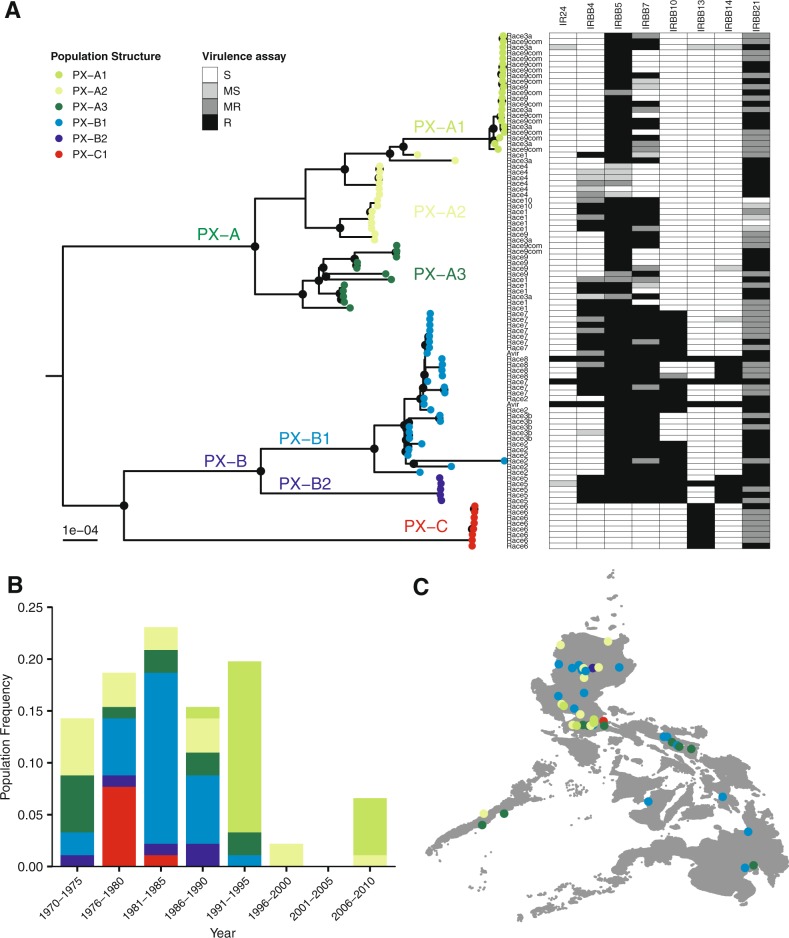
Fig. 2.
Phylogenetic relationship and population structure of Xanthomonas oryzae pv. oryzae (Xoo) strains collected in the Philippines between 1970 and 2015. a A maximum-likelihood phylogenetic tree constructed with core genome alignment using bootstrap of 1000. Black nodes depict bootstrap score of ≥90. Lineage designations PX-A, PX-B, and PX-C were adapted from Quibod et al. [16]. Population PX-A1, PX-A2, PX-A3, PX-B1, PX-B2, and PX-C1 were predicted from BAPS cluster analysis [32]. Race designation is displayed for each strain. The right-side panel shows differential virulence phenotypes based on the reaction to seven near-isogenic lines carrying single Xa genes (Table S1). Lesion lengths were averaged across 15 replicates. The reaction is as follows: R resistant, MR moderately resistant, MS moderately susceptible, and S susceptible. b Temporal distribution of PX populations isolated in the Philippines between 1970 and 2015. The numbers of strains in each time periods are: 1970–1975 = 13, 1976–1980 = 17, 1981–1985 = 21, 1986–1990 = 14, 1991–1995 = 18, 1996–2000 = 2, 2001–2005 = 0, and 2006–2010 = 6. c Spatial distribution of PX populations recovered from different islands in the Philippines archipelago

